


Library Stories
4
17
For the past two months, I have had the opportunity to work as a student helper in the Library’s Archives and Special Collections, helping set up an exhibition titled “Travelling in Maps: Exploring Tourist Asia (1890-1950)”. This showcases a selection of travel maps created during a transformative period in Asian travel history, with improving transportation networks turning perilous journeys into more accessible explorations, allowing more people to have access to tourism.
CollectionsExhibitionsNewsPeople

Library Stories
As HKUST celebrates its 35th anniversary, the Library reflects on a story that began alongside the founding of our University. It is a story of innovation, partnership, enduring care, and the quiet dedication that has supported our academic mission for over three decades.
BuildingPeople
Library Stories
Library Stories
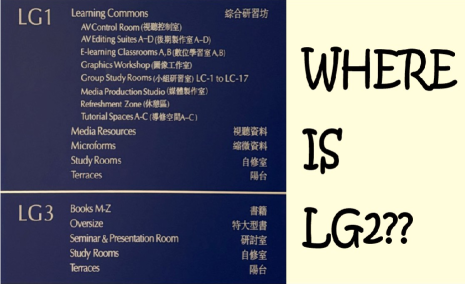
New students (and faculty!) often ask why there is no LG2 in the Library. The answer is really simple: the Library is part of the main academic building, and LG2 is in between LG1 and LG3 – when viewed from the side. :-) The initial campus planning guides from 1988 designated every floor in the building by its height above sea level. So the five planned Library floors were Levels 128, 123, 118, 113, and 108. These became 1/F, G/F, LG1, LG3, and LG4. But wait - why is LG2 missing?
BuildingPeople
Library Stories
Library Stories
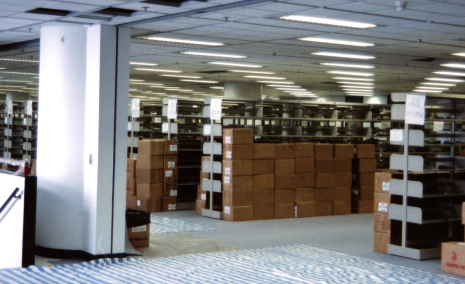
Most stories about the founding of the University skip over all of the immense effort needed not just to build the physical place, but to hire initial faculty and staff who would be responsible for getting all the pieces set up and ready to go for the first day of classes. I was hired in the summer of 1990 as part of a team to help the University Librarian ensure that the Library would be ready. I won't go into all the details, but highlighting a few will give you some sense of what was going on back then.
BuildingCollectionsPeople
Library Stories
Library Stories
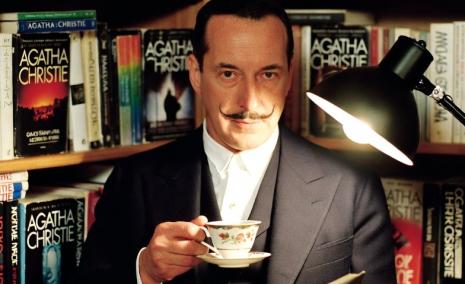
Agatha Christie is one of the best-selling novelists, with her novels holding the Guinness World Record as the best-selling fiction author of all time, having sold over two billion copies (Guinness World Record, 2026). But what truly sets her apart from other detective fiction writers is this: her novels reward rereading. Unlike many mystery novels where the sole purpose is discovering the murderer’s identity, Christie’s books are worth revisiting because the “truth” is always unexpected—yet on a second read, you’ll discover hints cleverly hidden throughout. The clues were always there; we simply didn’t see them.I randomly picked up a detective novel in a library after reading some Sherlock Holmes, and began my journey with Christie through The Murder of Roger Ackroyd. What struck me immediately was her daring decision to center the story around a first-person narrator who is intimately tied to the investigation, yet whose account subtly manipulates the reader’s trust in ways that shatter genre expectations. This twist forces you to reevaluate every detail from a new angle upon finishing, making it a landmark in detective fiction that you’ll itch to experience for yourself. It was brilliant and disorienting in the best possible way.
CollectionsNews
