


Scholarship increasingly deploys digital tools and methods to create, enhance, preserve, and disseminate scholarly research and knowledge across disciplines.
The library team is eager to explore ways to support digital scholarship at HKUST !
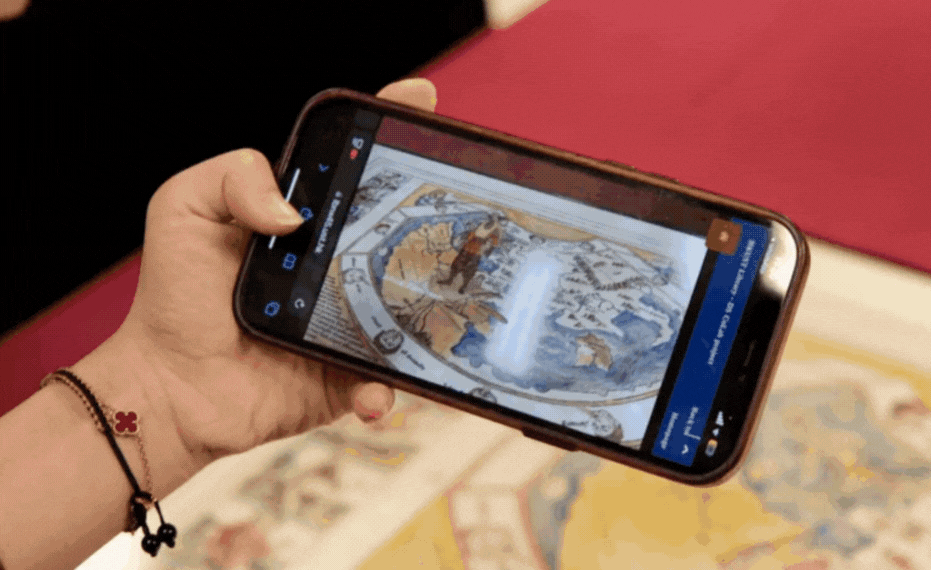
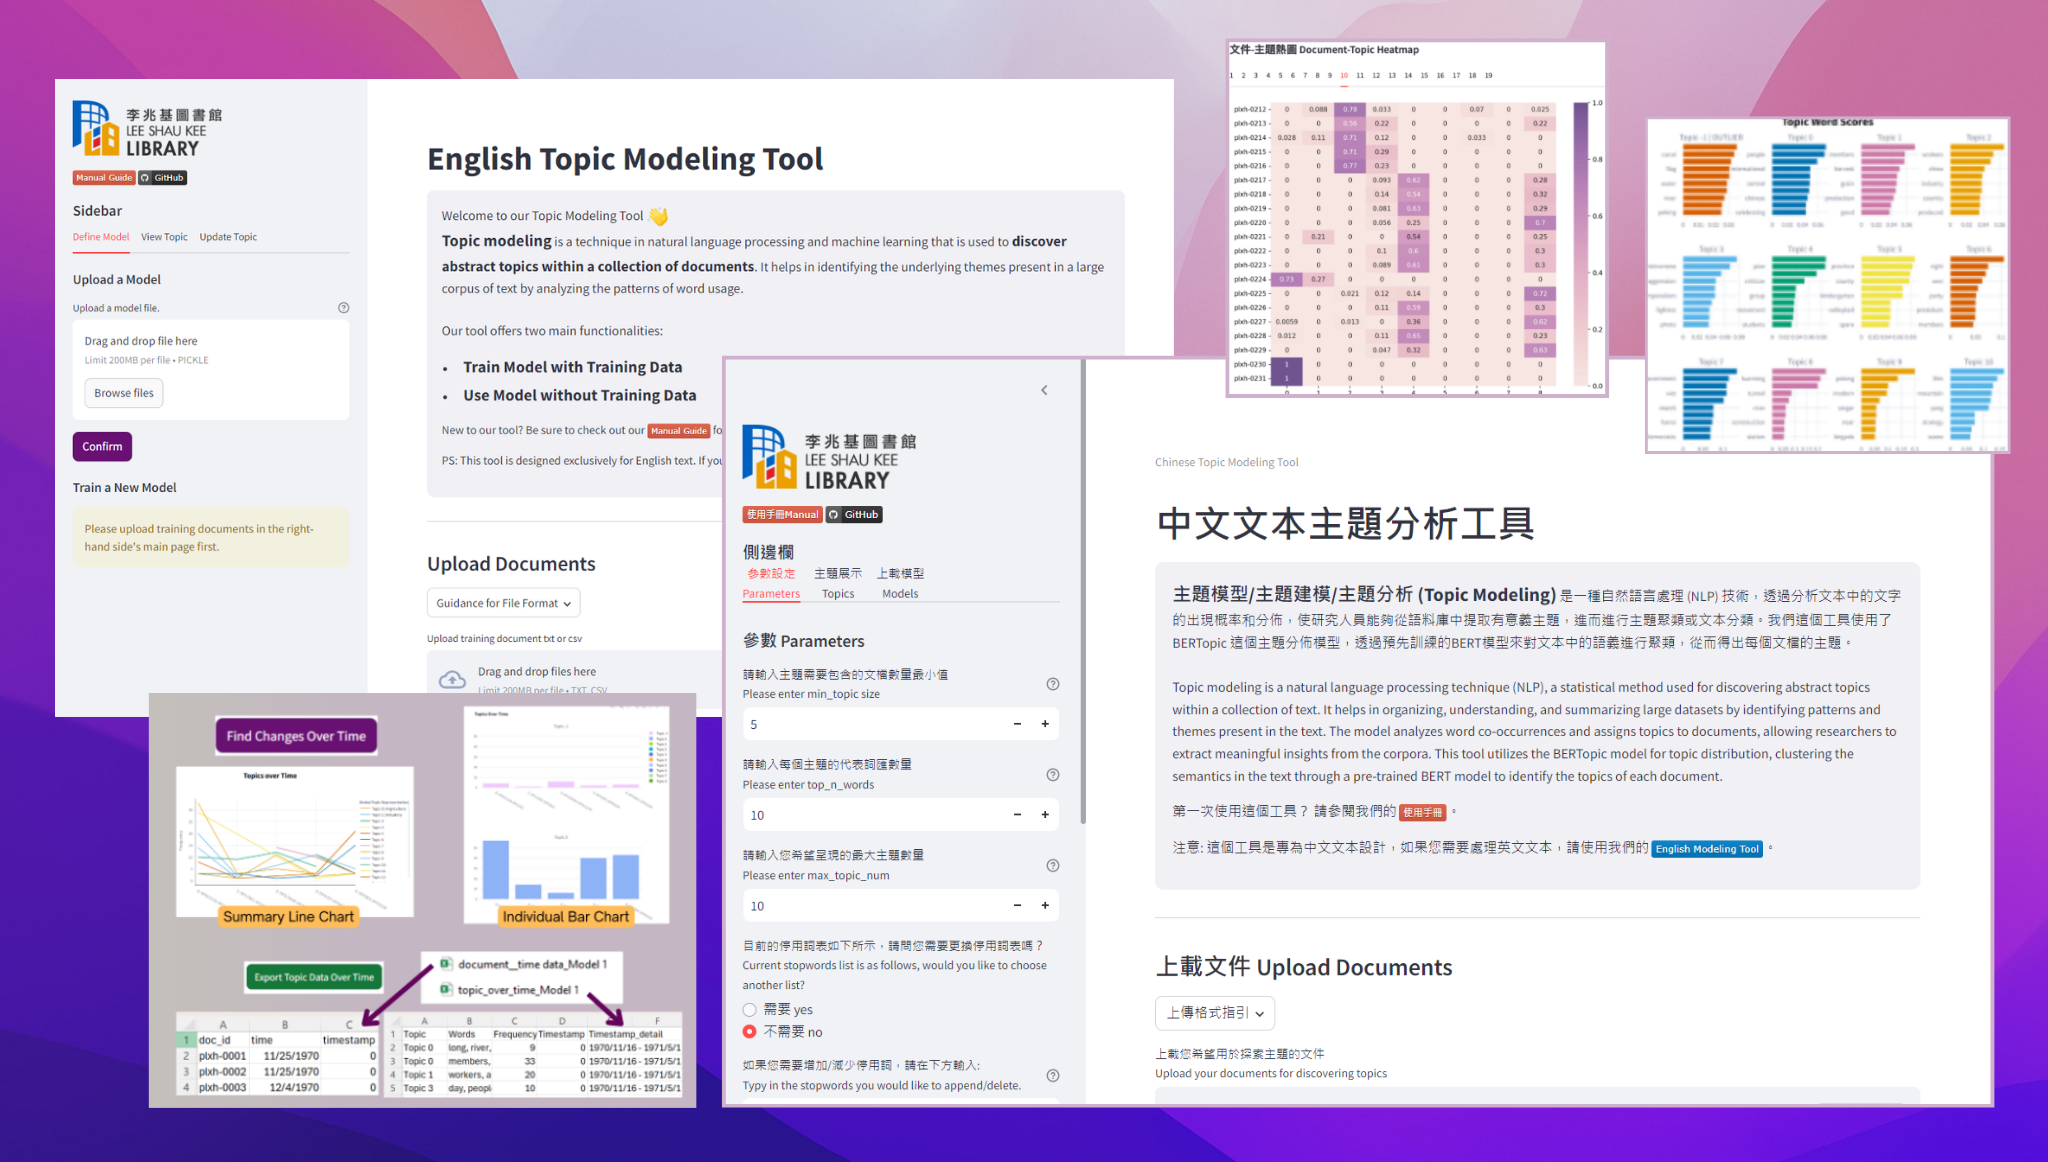
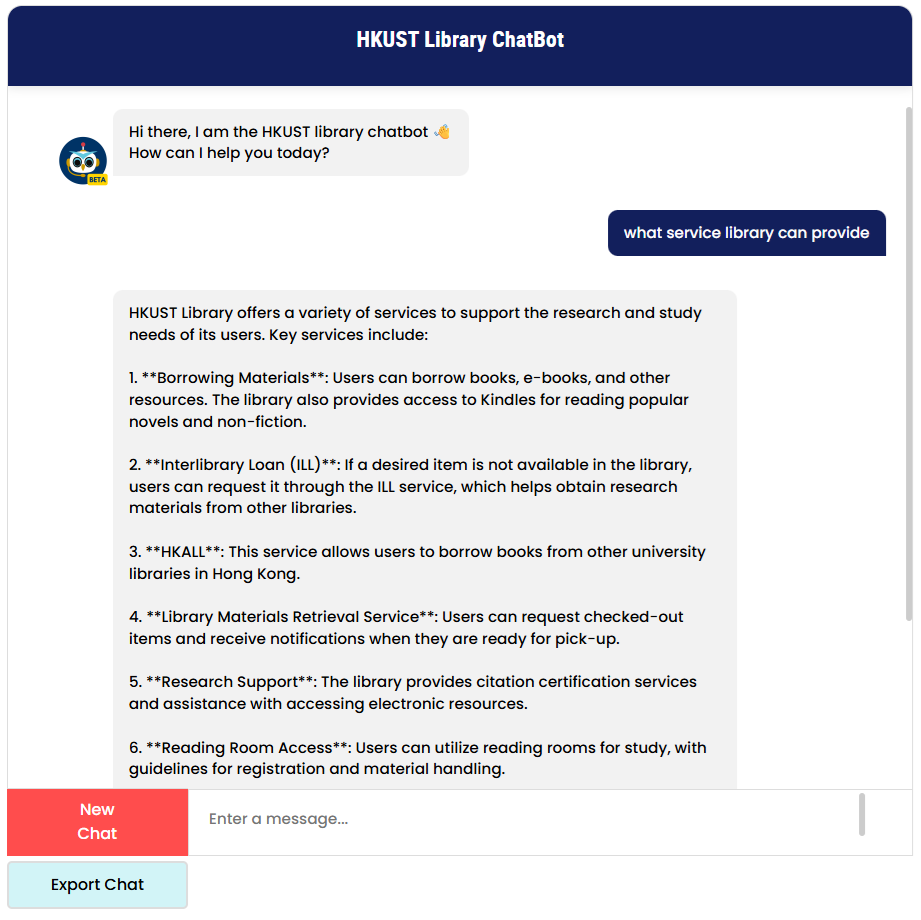
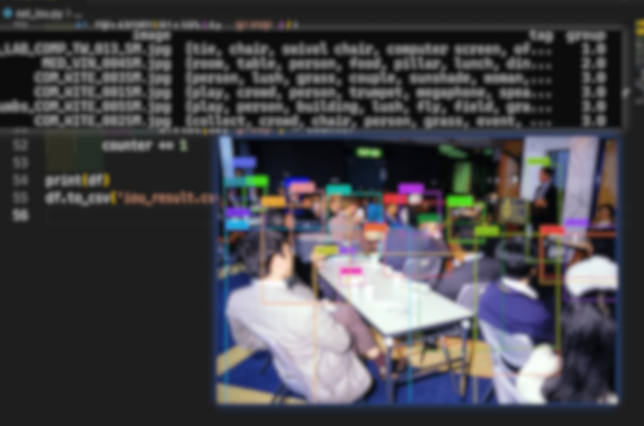
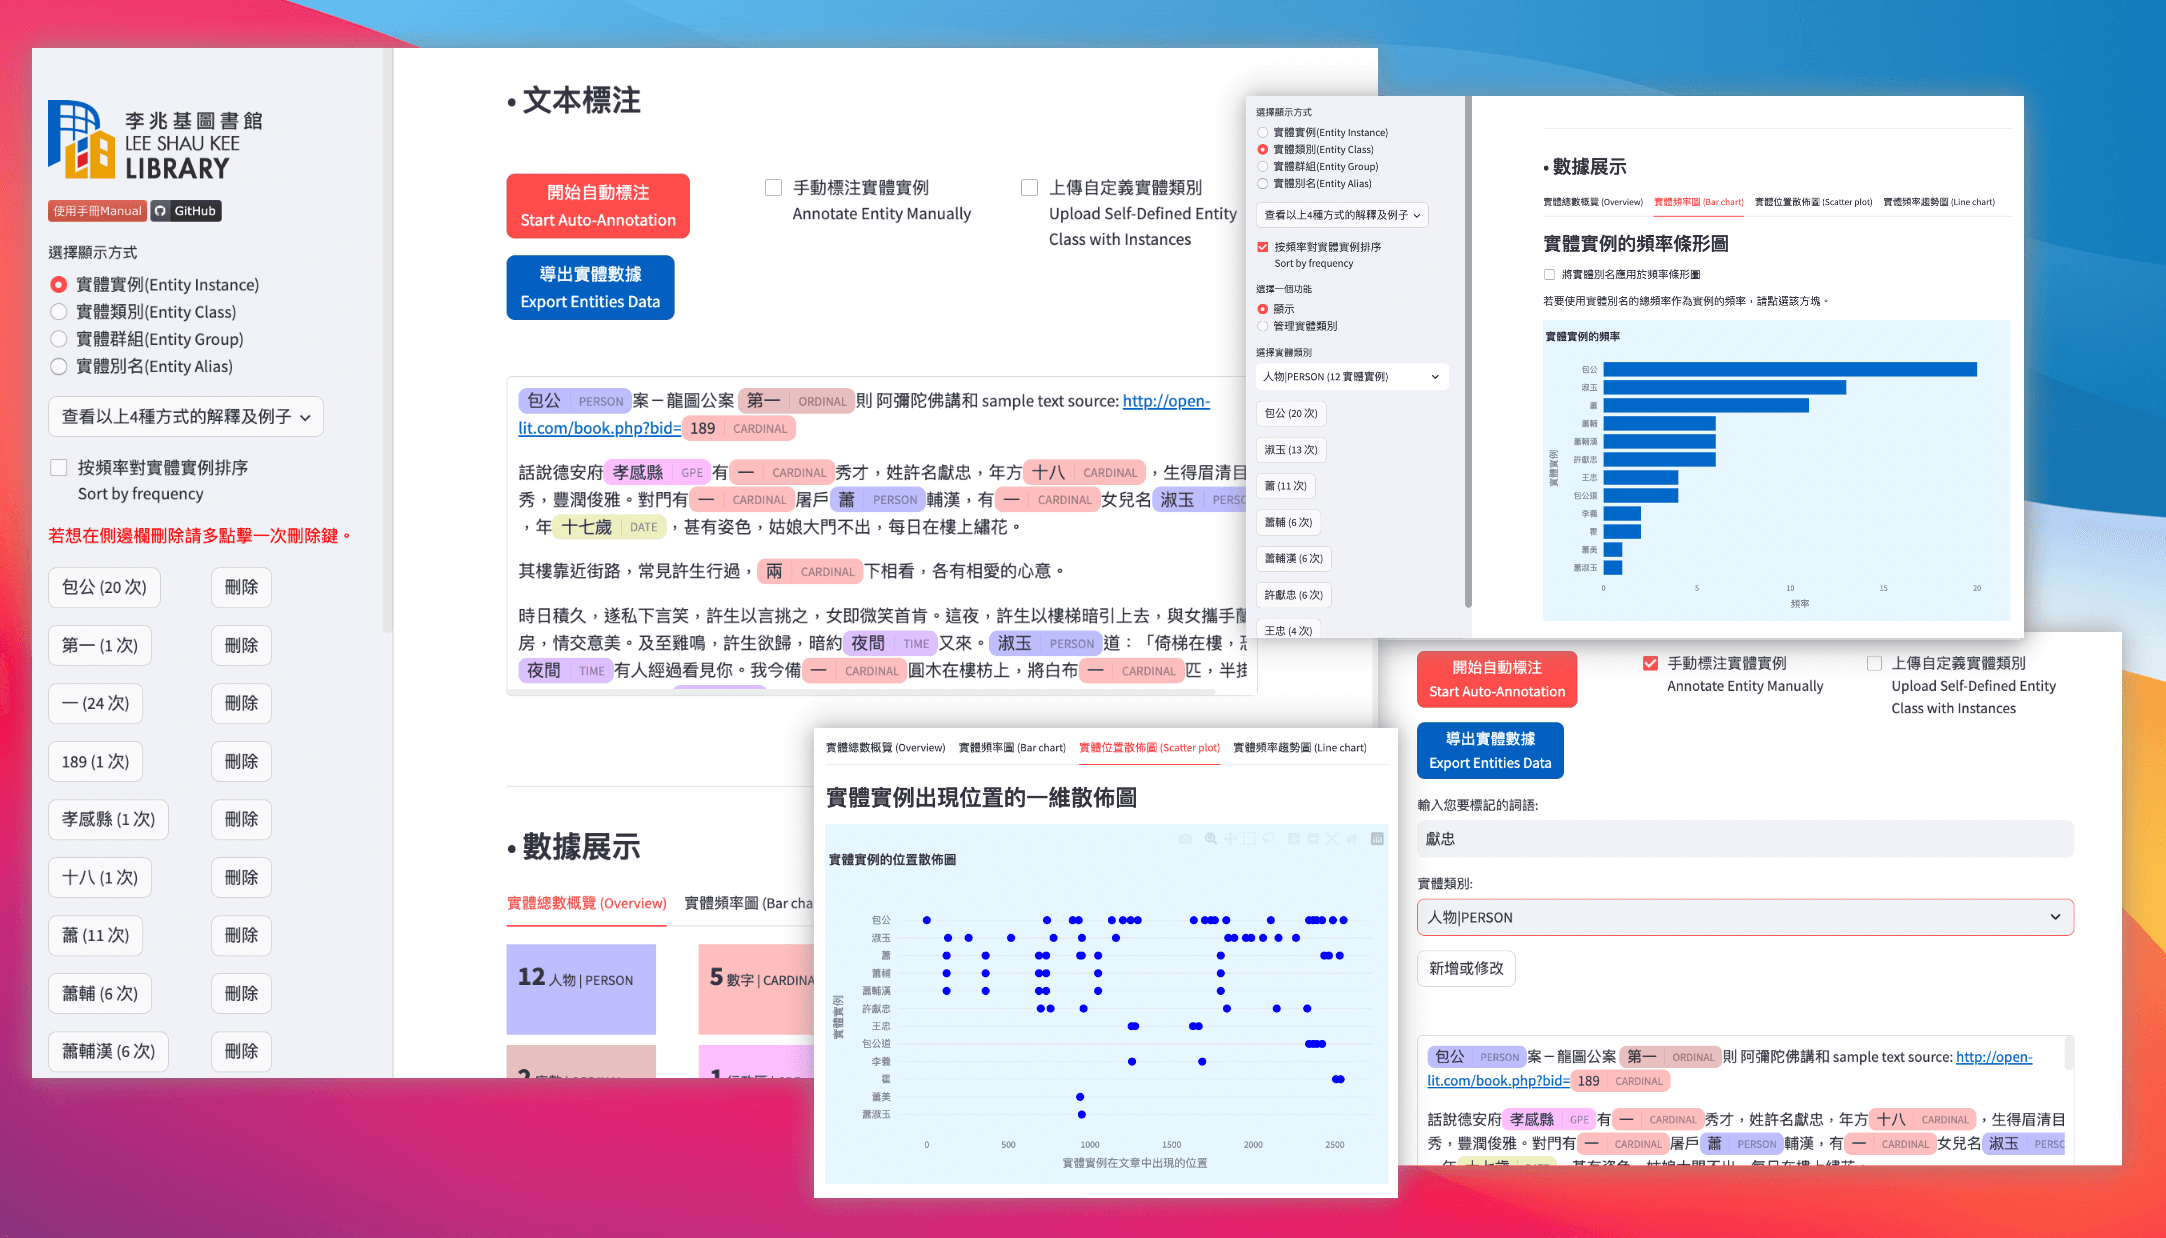
DS COLAB
DS Colab is a collaborative, co-learning program for students and the Library's DS team. We work together on projects that explore digital tools and AI in practical DS scenarios.
RESEARCH DATA SERVICES
Data repository, Data Management Plans, and workshops that build your research data management skills, including data cleaning, analysis, visualization, and more.
DIGITAL HUMANITIES INITIATIVE
Explore the outcomes of the DH Initiative, a joint effort of the Division of Humanities and the Library.
DIGITAL PRESERVATION
Resources about digital preservation, and the Library's effort to assist digital curation and preservation of HKUST research artefacts.
PROJECTS
We are currently working on several exciting digital projects with our students from different disciplines. Stay tuned for further updates!
A collection of digital humanities work from the library, faculty, and students at HKUST.
Talk with us !
Have any ideas?