


DS Student Learning Journey Sherry YIP DS P003
YIP Sau Lai, Sherry
Year 4, BSc in Data Science and Technology
See below the words from Sherry regarding her experience on this project !
Sherry is one of our student interns who actively participated in our project about developing a English Topic Modeling Tool during the 2024/25 Fall Semester (Sep-Dec 2024).
1. Introduction
Developing user-friendly web tools for non-technical users is challenging that requires us to keep learning and adjusting along the way. This is my second time to participate in the Library’s DS CoLab project. This opportunity not only enables me to apply lessons from past projects but also to gain new insights to refine my approach. This reflection details the process of our pre-project research, implementation strategies, and additional considerations that helped us shape our topic modeling web tool to be way more intuitive and effective in this project.
2. Pre-project Research
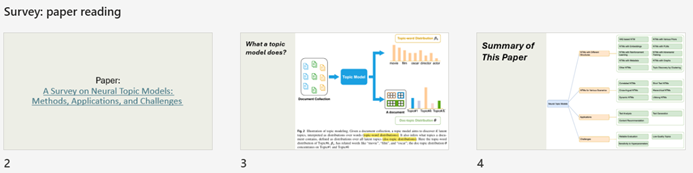
2.1 Paper Reading
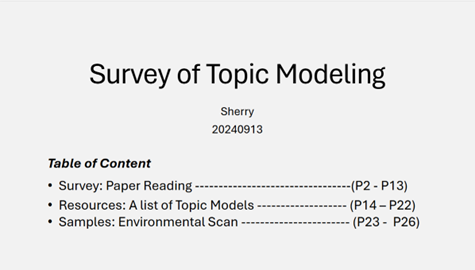
In this project, I found that getting into published papers really helps grasp a field faster. Survey papers are awesome for showing both traditional and innovative approaches and their applications. They’re perfect for understanding the field, aiding in the selection of models and functionalities for web tool development.
Focusing on topic modeling, I found this pivotal survey paper (https://doi.org/10.1007/s10462-023-10661-7) that was helpful in solidifiying my foundation and expanded my insights. Additionally, this review revealed a range of sophisticated algorithms designed to address the complexities of topic modeling, including dynamic and hierarchical variants. Although some concepts initially seemed daunting, they were ultimately crucial for integrating existing toolkits and innovating new functionalities.
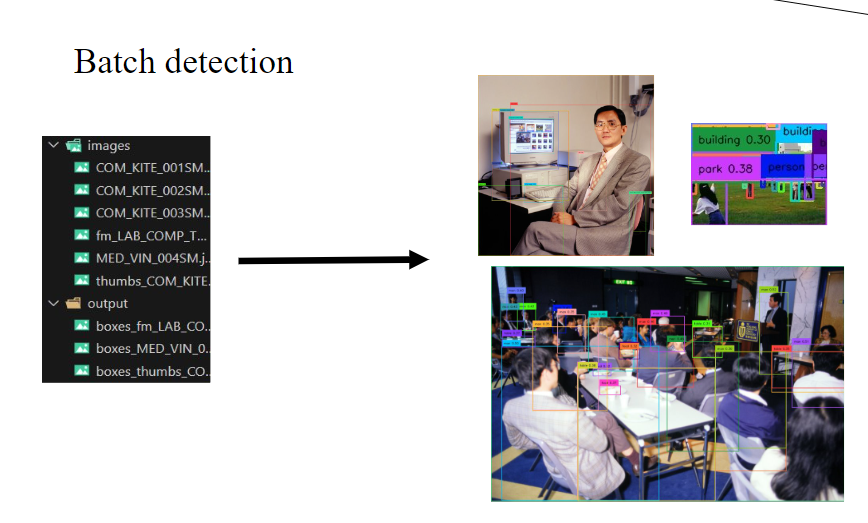
For example, after thorough consideration, I chose to use BERTopic as the primary toolkit due to its robust features. With an understanding of these advanced concepts, I streamlined our use of BERTopic, eliminated unnecessary functions, and successfully introduced a novel feature—temporal topic modeling—into our product.
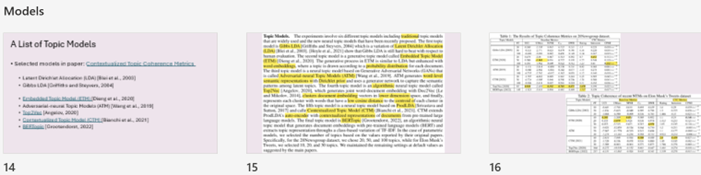
2.2 Model Selection
In selecting an appropriate model for topic modeling, I conducted extensive research on various models, comparing their attributes. Survey papers and related literature were invaluable in guiding my choice. Experiments within these papers often provided comparative analyses of different solutions, offering detailed insights into their strengths and weaknesses. This information was pivotal for making decisions based on performance and targeted applicability. Beyond these factors, integration complexity with user interfaces and the computational resources are required, such as GPUs, also played crucial roles in the selection process.
After evaluating performance and targeted applicability, I initially shortlisted two models: CTM and BERTopic. BERTopic’s user-friendly Python package and its independence from GPU resources made it the preferable choice from our analysis.
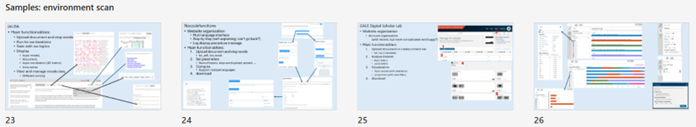
2.3 Functionality Selection
Environmental Scan: In our pursuit of developing a user-friendly tool, it is paramount to identify operations, visualizations, and statistical outcomes that will be beneficial and comprehensible to our prospective users. Studying similar platforms that have been previously developed allowed us to highlight their strengths and avoid their weaknesses. In the previous DS CoLab project, I did similar task on analyzing the existing platforms, but the findings could be presented in a more organized information layout when I looked back this time. To improve this time, I utilized flowcharts and screenshots of key components to elucidate the functionalities of the researched platforms, a strategy that significantly outperformed the summary table used in my earlier DS CoLab project.
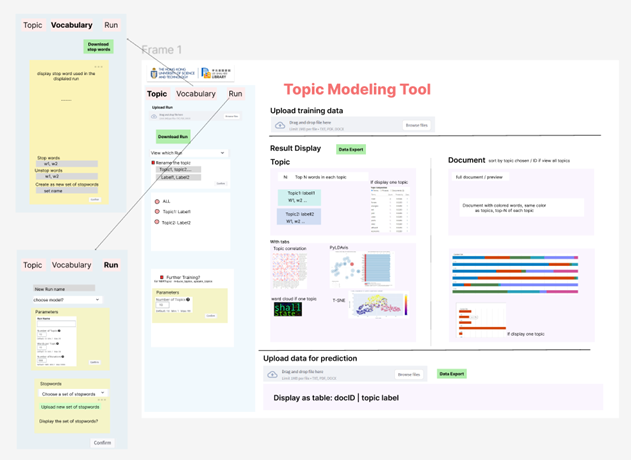
UI Design: Drawing insights from existing platforms, it was time to define our own set of functionalities. Using Figma, I meticulously designed the functionalities and their placements. This exercise not only laid the groundwork for the future but also guided decisions regarding data structures and code organization during the subsequent implementation phase.
3. Implementation
3.1 Separating Function Definitions into Files
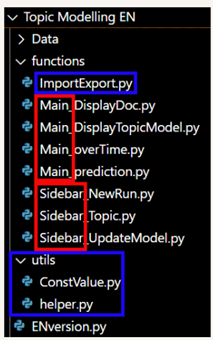
I organized the Python function definitions according to their positions within the user interface, specifically across various tabs in the sidebar and sections on the main page. This is because most functionalities in this web tool are independent, with limited overlap between functions across different tasks. Additionally, the UI design clusters related functionalities within the same sections, making it logical to arrange function definitions by their UI location. Nevertheless, some functions that span multiple functionalities are grouped by their operations, such as those stored in “ImportExport.py” and the “utils” folder.
3.2 Streamlining Display Operations to Reduced Refreshing Time
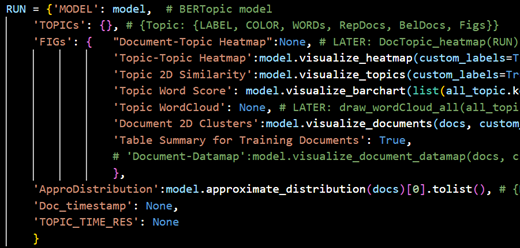
A critical factor affecting the tool’s usability is the refresh time following each operation, which needs to be minimal for a seamless user experience. To improve this, I implemented tab navigation for switching displays, which does not need full-page refreshes. Additionally, I optimized the tool by storing display data and pre-rendered figures as variable values. This strategy considerably decreases the time spent on function calls and figure preparation during refreshes.
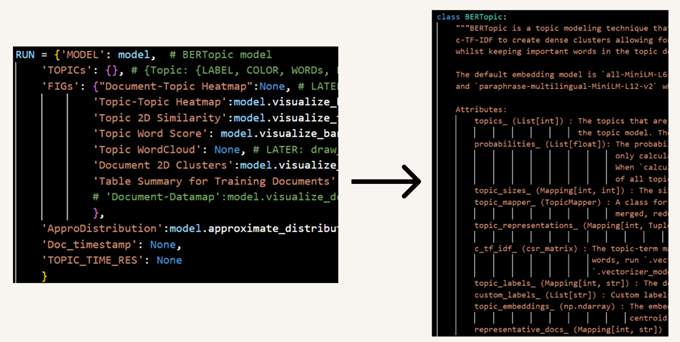
3.3 Future Improvement in Data Structure: from PyDict to PyClass
A significant learning outcome from this project was the potential enhancement of data structures. Initially, I used Python dictionaries for data management. However, inspired by the data structure design in the BERTopic package, I recognized that Python classes could offer a more effective solution. Because data storage can be coupled with class methods, enabling a clearer distinction between data management functions and other operations, such as UI interactions. This realization has prompted me to adopt this improved practice in future projects.
4. Additional Concerns Regarding User-Friendliness
4.1 Use Concrete Examples to Represent Abstract Technical Concepts
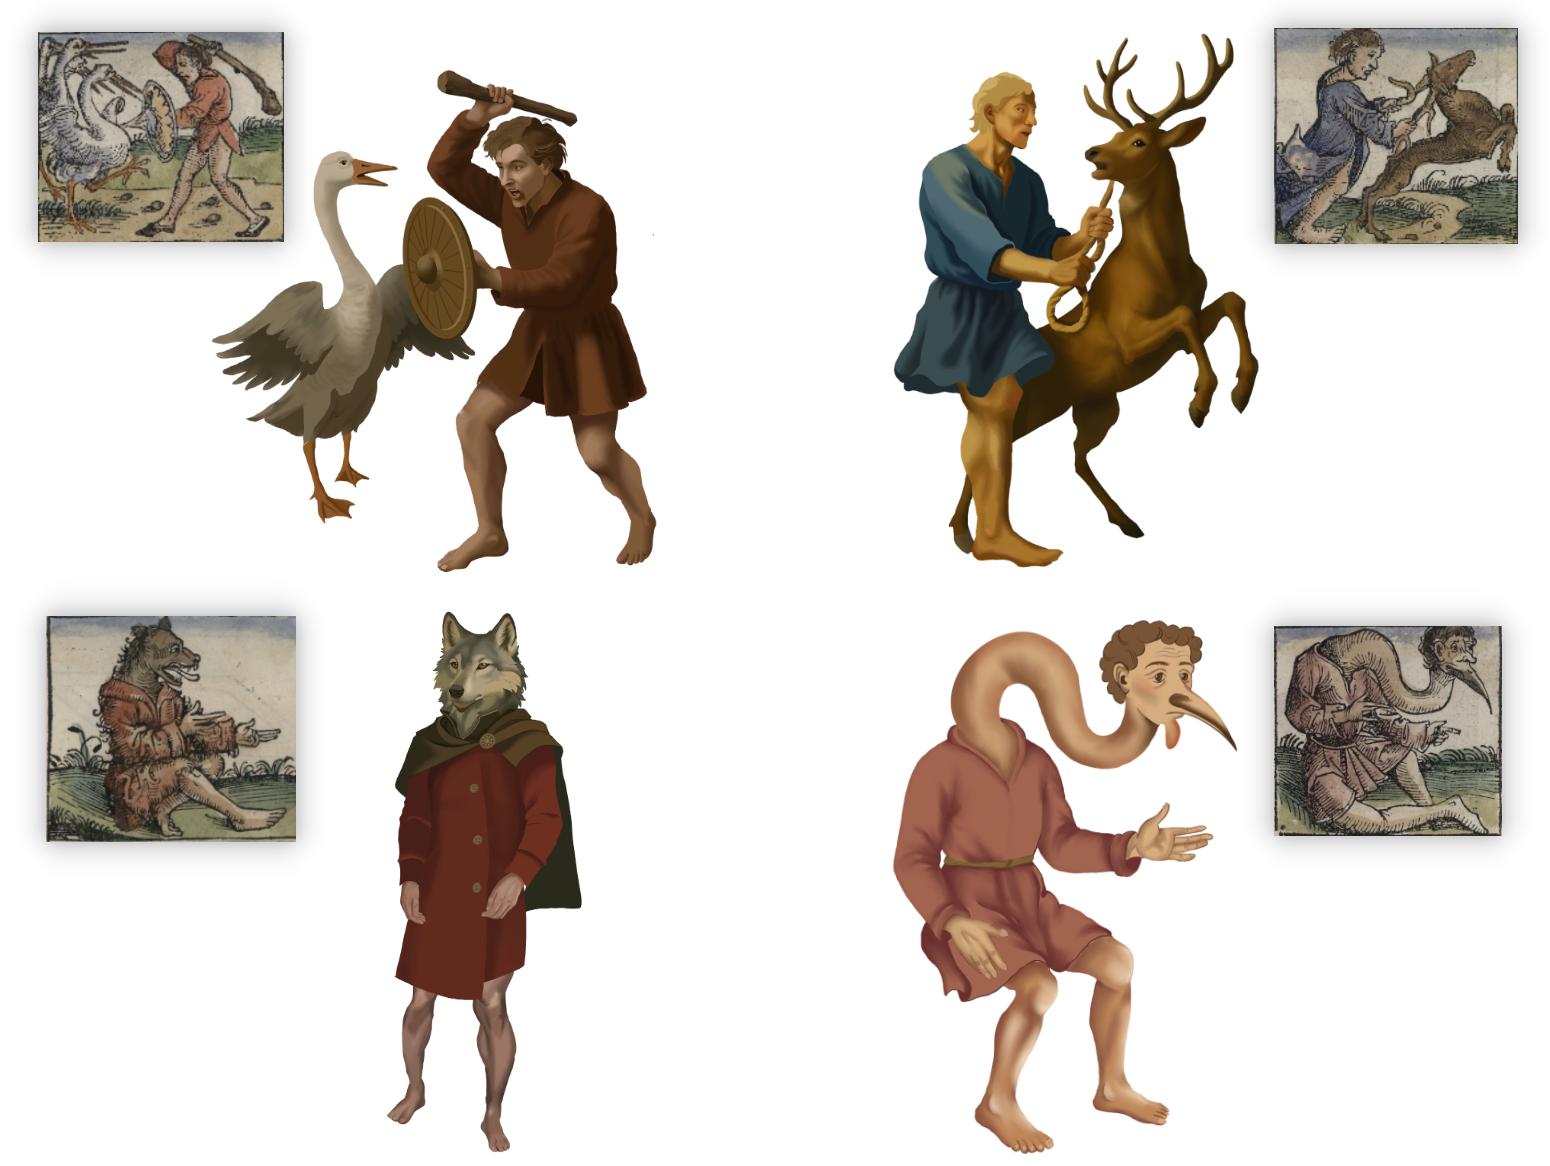
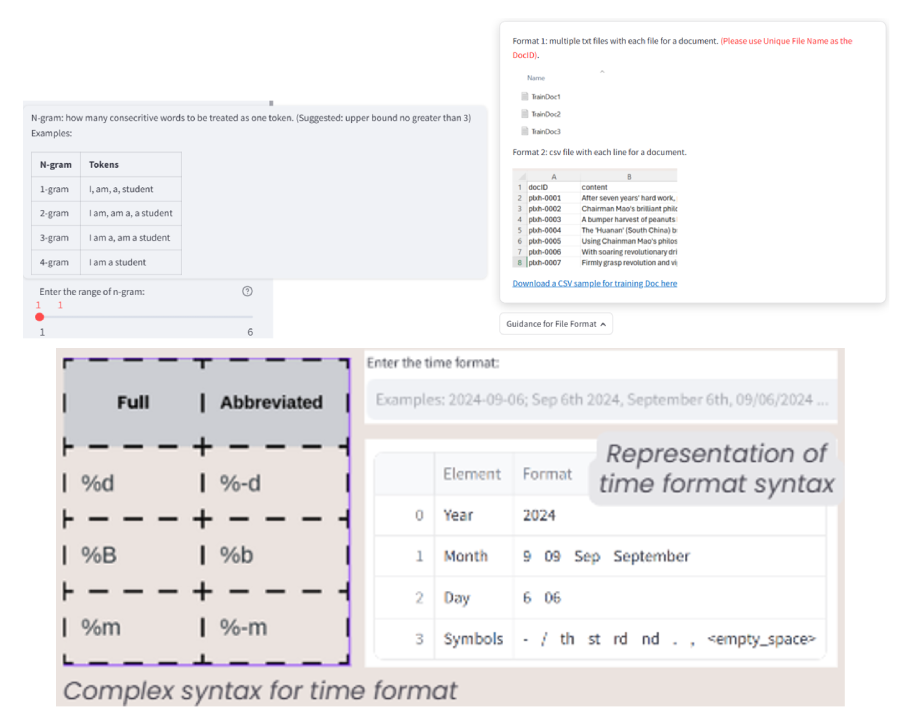
I have exerted effort to enhance the user-friendliness of the tool. Aware that many potential users may lack a robust technical background in computer science, I have included concrete examples to provide clear guidance and explanations.
An example is the customization of time formats in our tool. In Python, time formats are specified using a combination of special characters, which are not easily readable and can be challenging to understand. To address this, I replaced the complex syntax with elements of an actual date that are more recognizable to non-technical users.
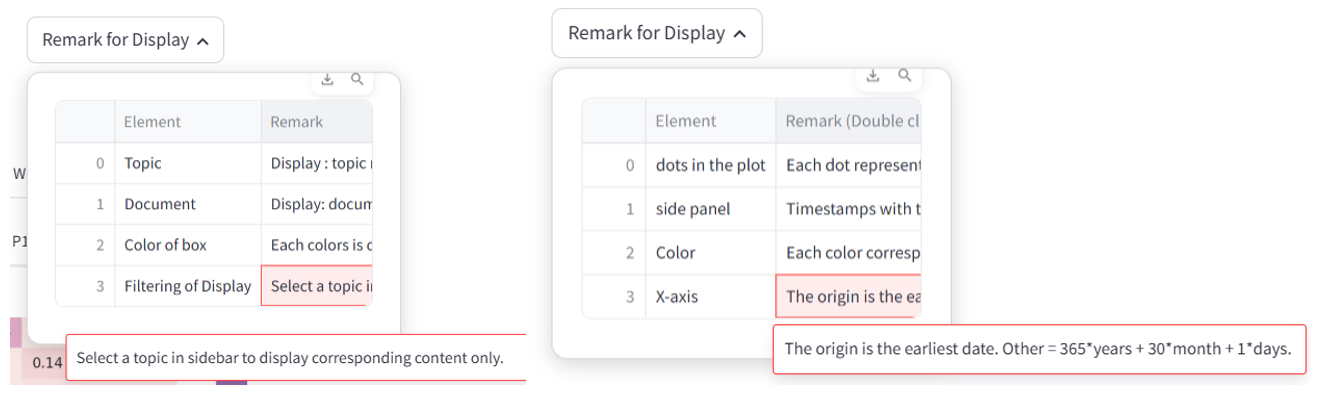
4.2 Remark for Display
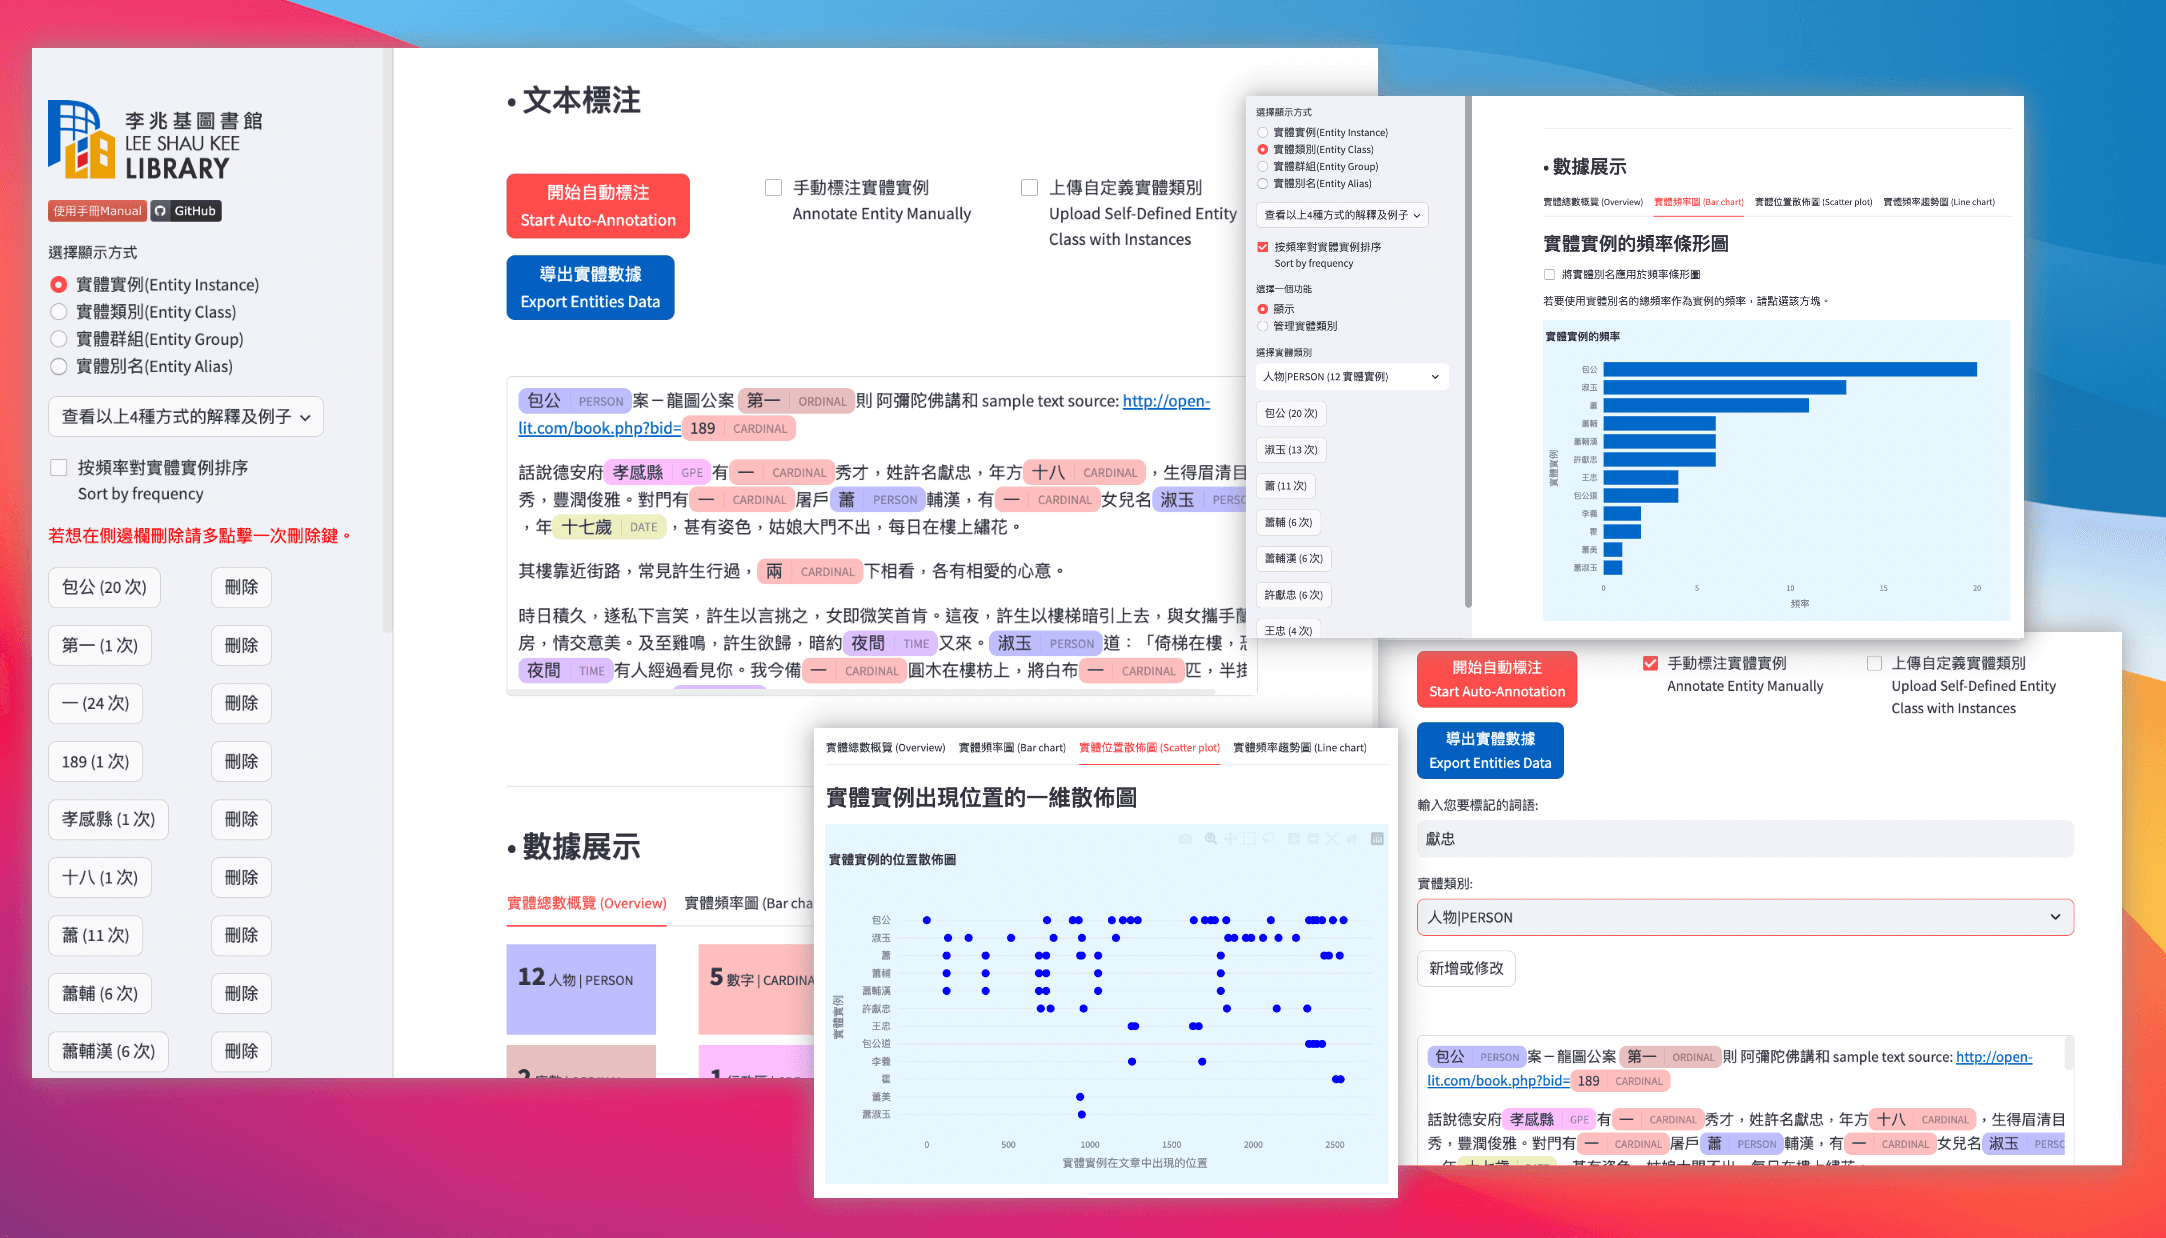
To aid in understanding operations and visualizations, I have provided detailed remarks. Feedback from teammates highlighted the difficulty in interpreting visualizations for those who are not developers. Therefore, it is essential to clearly explain the significance of each element and how these visualizations contribute to assessing the quality of the results.
5. Conclusion
The development of this web tool was not just about technical execution but also about deepening the understanding of what makes a tool user-friendly. The iterative process of learning from past projects, engaging with current research, and responding to user feedback was crucial in achieving a tool that is both powerful and accessible. As I move forward, these insights will continue to influence my approach to technology development, always with an eye towards making complex tools usable and useful for everyone.