


Total Transactions
| 2020-21 | 2021-22 | 2022-23 | 2023-24 | 2024-25 | |
|---|---|---|---|---|---|
| Requests Handled | 15,183 | 8,406 | 6,983 | 6,565 | 6,134 |
Interlibrary Borrowing
| 2020-21 | 2021-22 | 2022-23 | 2023-24 | 2024-25 | |
|---|---|---|---|---|---|
| Requests Handled | 4,344 | 3,909 | 3,244 | 3,024 | 2,411 |
| Fill Rate | 89.45% | 84.91% | 85.78% | 81.02% | 81.47% |
| Days Needed | 4.32 | 3.98 | 3.48 | 2.99 | 3.06 |
Interlibrary Lending
| 2020-21 | 2021-22 | 2022-23 | 2023-24 | 2024-25 | |
|---|---|---|---|---|---|
| Requests Handled | 10,577 | 4,329 | 3,626 | 3,458 | 3,638 |
| Fill Rate | 64.67% | 64.36% | 66.69% | 66.71% | 66.85% |
Document Delivery
| 2020-21 | 2021-22 | 2022-23 | 2023-24 | 2024-25 | |
|---|---|---|---|---|---|
| Requests Handled | 262 | 168 | 113 | 83 | 85 |
| Days Needed | 0.91 | 1.03 | 0.90 | 0.96 | 1.27 |
Go Back to page
Borrowing & Document Delivery Transactions by User Group 2024-25
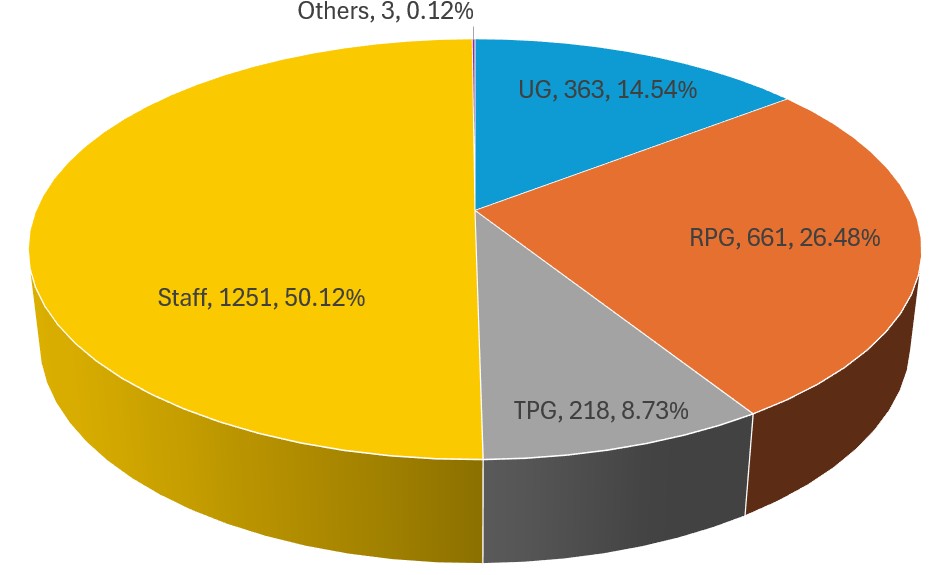
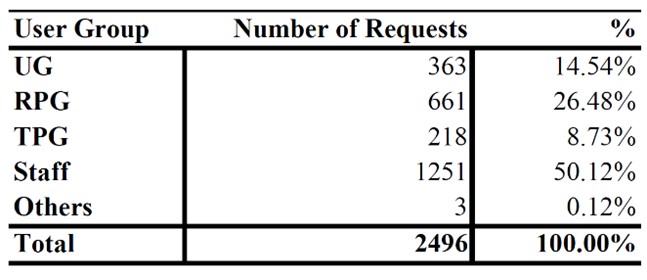
Note: “Staff” includes faculty members and all other staff; alumni cannot use ILL.
Last modified date 14 Jan 2026