Issue No. 28
May 1998
HKUST Library – Facts & Figures
During the past two months, the Library has sent out two emails to the faculty advising them not to forward any new requests to the Library as a result of the recent budget reduction imposed by the University Administration.
This “extra” issue, intended for internal circulation only, is prepared as a follow-up to those two emails. It provides you with some facts and figures on the history and present allocation of the library materials budget; the pertinent services offered to complement the collection; and the current state of the Library collection. Some information on how the HKUST Library compares with the other Hong Kong academic institutions is also included.
Figure 1: Library Materials Budget, 1990 – 1998
| Allocated Materials Budget |
BTE Funds |
Supplemental Year-End Funds |
TOTAL | |
|---|---|---|---|---|
| 1990/91 | $36,012,598 | $36,012,598 | ||
| 1991/92 | $26,700,000 | $26,700,000 | ||
| 1992/93 | $36,230,000 | $3,073,193 | $39,303,193 | |
| 1993/94 | $35,000,000 | $8,918,899 | $43,918,899 | |
| 1994/95 | $30,000,000 | $989,263 | $15,940,000 | $46,929,263 |
| 1995/96 | $20,000,000 | $2,599,939 | $4,000,000 | $26,599,939 |
| 1996/97 | $30,000,000 | $2,116,978 | $32,116,978 | |
| 1997/98 | $35,000,000 | $600,000 | ($1,815,000) | $33,785,000 |
| 1998/99 | $20,000,000 |
The Library materials expenditure averaged $35.6 million in each of the past seven years. In 1994/95, an extra surplus fund, in the amount of close to $16 million was given to the Library. Consequently, the materials budget in the following year, 1995/96, reflected a $15 million reduction.
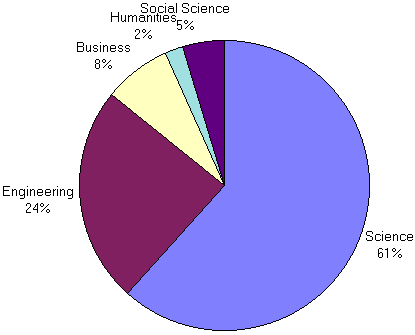
Figure 2: Print Journal Expenditures for 1996/97
 |
Science and Engineering titles accounted for 85% of the periodical expenditure. For the number of journal subscriptions of each academic department, see Figure 5. |
Figure 3: Database Expenditures for 1996/97
| The expenditures for online searching including Lexis-Nexis, Reuters, and Dialog are funded under a separate account and are not included in this chart. |  |
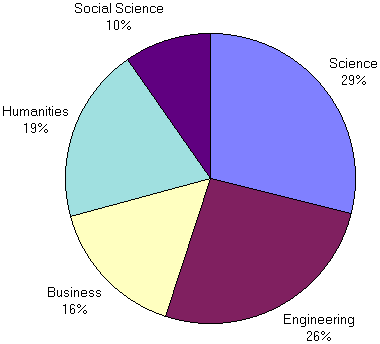
Figure 4: Monograph Expenditures for 1996/97
 |
The average cost per book in Social Science and Humanities is substantially lower than the books in Science and Engineering. Therefore, it was possible to acquire more books in Humanities and Social Science than that of Science and Engineering. |
Figure 5: Print Journal Subscriptions for 1996/97
| Department/Division/School | No. of Titles for 1996/97 |
Expenditure (HK$) 1996/97 |
% of Total Print Journal Expenditures 1996/97 |
No. of Faculty 1996/97 |
|
|---|---|---|---|---|---|
| School of Science | |||||
| Biochemistry | 125 | 801,030.84 | 5.39% | 19 | |
| Biology | 285 | 2,211,350.08 | 14.88% | 26 | |
| Chemistry | 183 | 2,203,905.24 | 14.83% | 25 | |
| Mathematics | 233 | 1,536,713.53 | 10.34% | 40 | |
| Physics | 179 | 2,101,414.09 | 14.14% | 32 | |
| Science (General) | 65 | 173,513.33 | 1.17% | 1 | |
| Sub-Total | 1070 | 9,027,927.11 | 60.75% | 143 | |
| School of Engineering | |||||
| Chemical Engineering | 112 | 866,850.26 | 5.83% | 17 | |
| Civil & Structural Engineering | 167 | 965,015.11 | 6.49% | 27 | |
| Electrical & Electronic Engineering | 193 | 457,300.17 | 3.08% | 51 | |
| Industrial Engineering | 37 | 120,069.36 | 0.81% | 18 | |
| Mechanical Engineering | 115 | 500,481.00 | 3.37% | 24 | |
| Computer Science | 146 | 512,272.14 | 3.45% | 44 | |
| Engineering (General) | 36 | 114,389.84 | 0.77% | 4 | |
| Sub-Total | 806 | 3,536,377.88 | 23.80% | 185 | |
| School of Business and Management | 381 | 927,499.35 | 6.24% | 153 | |
| School of Humanities & Social Sciences | |||||
| Division of Humanities | 370 | 227,875.00 | 1.53% | 24 | |
| Division of Social Science | 362 | 666,750.16 | 4.49% | 27 | |
| Sub-Total | 732 | 894,625.16 | 6.02% | 51 | |
| Other | |||||
| Education Journals | 44 | 61,919.62 | 0.42% | ||
| General Journals | 86 | 345,636.17 | 2.33% | ||
| Library Science Journals | 49 | 65,923.33 | 0.44% | ||
| Sub-Total | 179 | 473,479.12 | 3.19% | ||
| Total Print Journals | 3168 | 14,859,908.62 | 100.00% | 532 | |
Figure 6: Projected Expenditures for 1998/99
| 1997/98* Est. Expenditures |
1998/99 Projected Needs |
|
|---|---|---|
| Books | $10,851,000 | $11,393,550 |
| Periodicals | $16,786,000 | $18,464,600 |
| Databases | $4,300,000 | $4,730,000 |
| Media | $792,000 | $500,000 |
| Microforms | $456,000 | $400,000 |
| Total | $33,185,000 | $35,488,150 |
| * The 1997/98 Budget was reduced from $35 million. | ||
It is estimated that in 1997/98, 33% of the materials budget was spent on books, 51% on journals, 13% on databases and 3% on media and microforms. Based on the publishing patterns of the past five years, an estimated inflation rate of 10% for periodicals and databases and 5% for books are included in the budget forecast.
Figure 7: Comparison of Library Materials Budget for UGC Member Libraries
| 1997/98 Budget |
1998/99 Budget |
|
|---|---|---|
| Chinese University of Hong Kong | $51,000,000 | $53,500,000 |
| City University of Hong Kong | $37,000,000 | $41,000,000 |
| Hong Kong Polytechnic University | $42,000,000 | $48,000,000 |
| HKUST | $33,185,000 | $20,000,000 |
| University of Hong Kong | $56,000,000 | N/A |
The budget figure for the University of Hong Kong is an estimated figure derived from a South China Morning Post article earlier this year.
Figure 8: Comparison of Print Periodical Subscriptions among UGC and Other Libraries
| University of Hong Kong | 14,228 |
| Chinese University | 9,652 |
| City University of Hong Kong | 8,608 |
| Hong Kong Polytechnic University | 7,772 |
| HKUST* | 3,651 |
| MIT | 21,000 |
| Virginia Tech | 18,737 |
| Georgia Tech | 12,726 |
| *Includes close to 500 newspapers, magazines and gift subscriptions |
The number of journal subscriptions in HKUST remains small. We rely heavily on interlibrary loan to supplement our journal collection.
Figure 9: Table of Lending and Borrowing Activities with Local Libraries, 1996/97
| Borrowed from HKUST |
Lent to HKUST |
|
|---|---|---|
| University of Hong Kong | 1487 | 1680 |
| Chinese University of Hong Kong | 1046 | 2956 |
| Hong Kong Polytechnic University | 3296 | 1627 |
| City University of Hong Kong | 1325 | 725 |
| Hong Kong Baptist University | 625 | 447 |
| Lingnan College | 231 | 172 |
| Hong Kong Institute of Education | 11 | 28 |
| Others | 746 | 24 |
| Total | 8767 | 7659 |
This table depicts ILL support received from local libraries. It also illustrates that the HKUST Library collection is pertinent to the needs of the other Hong Kong academic institutions.
Over 80% of the inter-lending activity consists of the photocopying of journal articles. Special arrangements have been made with CUHK to permit HKUST Library staff to make copies of journal articles on their premises.
Figure 10: Book Collection Circulation for Calendar Year 1997
| Number of Volumes |
Number of Circulations |
||
|---|---|---|---|
| Science | |||
| Biochemistry | 9,020 | 5,485 | |
| Biology | 16,210 | 7,324 | |
| Chemistry | 5,362 | 4,826 | |
| Mathematics | 11,579 | 10,689 | |
| Physics | 11,031 | 5,804 | |
| Science (Genr) | 5,000 | 1,225 | |
| Sub-Total | 58,202 | 35,353 | |
| Engineering | |||
| Chemical Engr | 5,079 | 3,365 | |
| Civil Engr | 13,132 | 12,426 | |
| Computer Science | 9,182 | 8,029 | |
| Electrical Engr | 7,334 | 10,417 | |
| Engineering (Genr) | 2,615 | 3,036 | |
| Industrial Engr | 3,115 | 2,689 | |
| Mechanical Engr | 3,805 | 2,765 | |
| Sub-Total | 44,262 | 42,727 | |
| Business | |||
| Accounting | 1,865 | 1,795 | |
| Economics | 26,666 | 9,550 | |
| Finance | 5,047 | 5,166 | |
| Management | 12,823 | 10,087 | |
| Marketing | 2,039 | 2,246 | |
| Sub-Total | 48,440 | 28,844 | |
| Humanities | 141,237 | 44,668 | |
| Social Science | 47,179 | 16,688 | |
| General | 6,289 | 5,274 | |
| Total | 345,609 | 173,554 | |
As a young library, HKUST has a relatively small book collection. Statistics reveal that this small collection is being used quite heavily.
Figure 11: Comparison of UGC Library Staffing and Opening Hours
| Professional Staff |
Support Staff |
Total Staff |
Open Hours per Week1 |
|
|---|---|---|---|---|
| University of Hong Kong | 42 | 182 | 224 | 89 |
| Chinese University of Hong Kong | 32 | 173 | 205 | 83 |
| Hong Kong Polytechnic University | 24 | 139 | 163 | 84.5 |
| City University of Hong Kong | 21 | 112 | 133 | 84 |
| Hong Kong University of Science & Technology | 22 | 81 | 103 | 93 |
| 1 The number of hours the Library is open each week during the regular school session | ||||
| The staffing figures in this chart are taken from a survey conducted in 1995 by City University of Hong Kong. The number of HKUST staff has been increased to 109 due to the provision of new services, and the opening of the University Archives. | ||||
Figure 12: Library Classes
| Library Classes 1995-1998 | |||
|---|---|---|---|
| Sessions | Attendees | ||
| Jul 95- Jun 96 | 98 | 1812 | |
| Jul 96- Jun 97 | 103 | 4167 | |
| Jul 97- Apr 98 | 139 | 4595 | |
| Details of Library Classes 1997/1998 | |||
| UG Classes | |||
| Business | 25 | 929 | |
| Engineering | 4 | 534 | |
| Huma & Sosc | 3 | 36 | |
| Science | 4 | 62 | |
| All Schools | 27 | 1293 | |
| PG Classes | |||
| Business | 18 | 455 | |
| Engineering | 5 | 98 | |
| Huma & Sosc | 2 | 32 | |
| Science | 0 | 0 | |
| All Schools | 2 | 147 | |
| Open Workshops | |||
| Research Skills | 1 | 13 | |
| Extel | 4 | 130 | |
| Job Hunting | 4 | 221 | |
| Web | 14 | 180 | |
| CNA | 2 | 51 | |
| L/Nexis,Reuters,TDC | 6 | 114 | |
| Microforms | 18 | 300 | |
| Total | 139 | 4595 | |
last modified 03 November 1998

