Total Transactions
| |
2018-19 |
2019-20 |
2020-21 |
2021-22 |
2022-23 |
| Requests Handled |
17,970 |
15,013 |
15,183 |
8,406 |
6,983 |
Interlibrary Borrowing
| |
2018-19 |
2019-20 |
2020-21 |
2021-22 |
2022-23 |
| Requests Handled |
5,473 |
4,503 |
4,344 |
3,909 |
3,244 |
| Fill Rate |
91.40% |
90.00% |
89.45% |
84.91% |
85.78% |
| Days Needed |
4.38 |
5.85 |
4.32 |
3.98 |
3.48 |
Interlibrary Lending
| |
2018-19 |
2019-20 |
2020-21 |
2021-22 |
2022-23 |
| Requests Handled |
11,803 |
9,853 |
10,577 |
4,329 |
3,626 |
| Fill Rate |
62.68% |
65.54% |
64.67% |
64.36% |
66.69% |
Document Delivery
| |
2018-19 |
2019-20 |
2020-21 |
2021-22 |
2022-23 |
| Requests Handled |
694 |
657 |
262 |
168 |
113 |
| Days Needed |
0.80 |
1.18 |
0.91 |
1.03 |
0.90 |
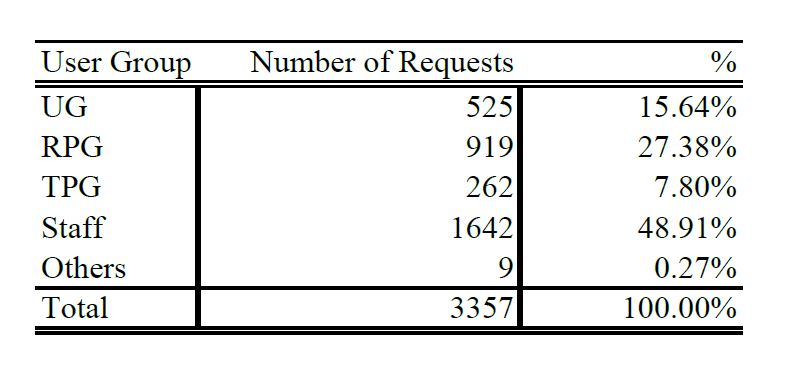
Borrowing & Document Delivery Transactions by User Group 2022-23
Note: “Staff” includes faculty members and all other staff; alumni cannot use ILL.
Go Back to page Top
last modified 22 August 2023