



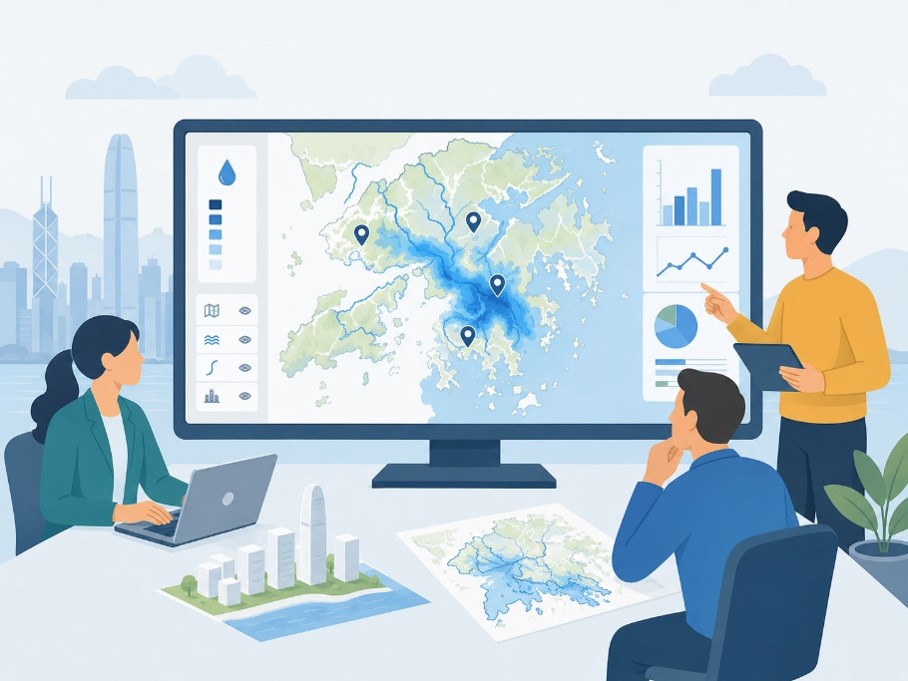
This June, as storms battered Hong Kong, Gary Lee, Research Support Librarian at HKUST who commutes daily across the New Territories from Yuen Long, started mapping. Read this post to learn how Gary used AI tools and public data to build an interactive 3D visualization of rainfall patterns and flood blackspots.

As the holiday season approaches, we hope to use a unique way to celebrate the incredible research achievements of HKUST in 2024 - turning our collective outputs into a festive Christmas tree!
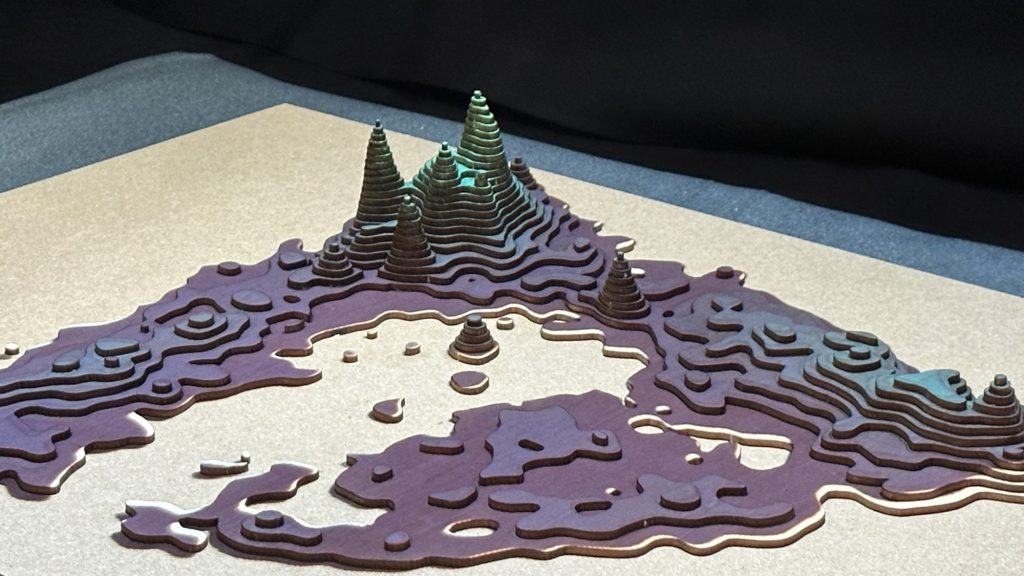
Loneliness is not on the mountain but on the street, not within one person but among many people. — Kiyoshi Miki
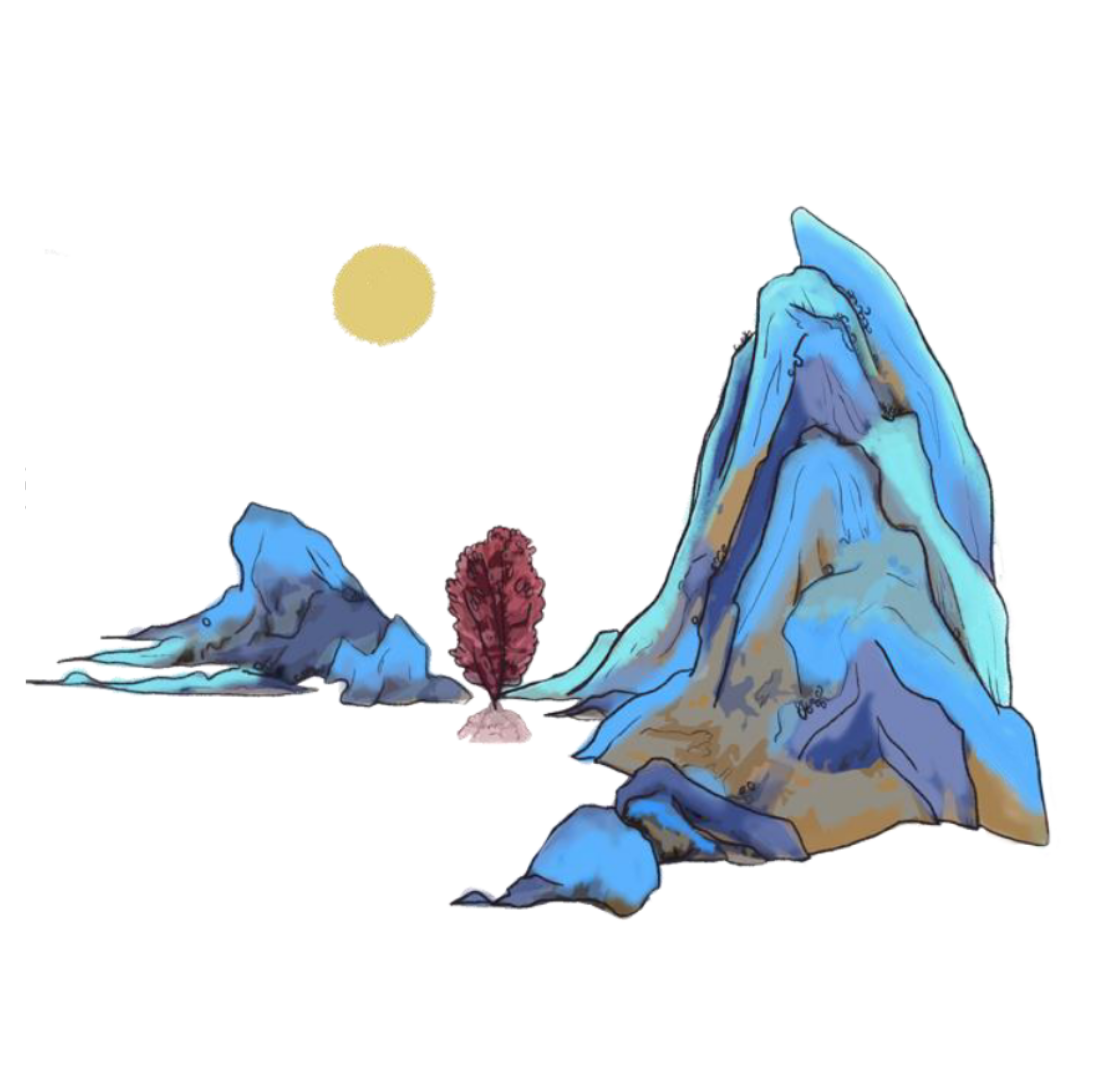
Ancient Chinese literature holds countless treasures, and among them, "The Classic of Mountains and Seas" stands out as a masterpiece of mythology and geography.
Exploring the research landscape of an institution has often meant turning to traditional academic databases like Web of Science or Scopus for publication information. However, open data is changing how we understand research.
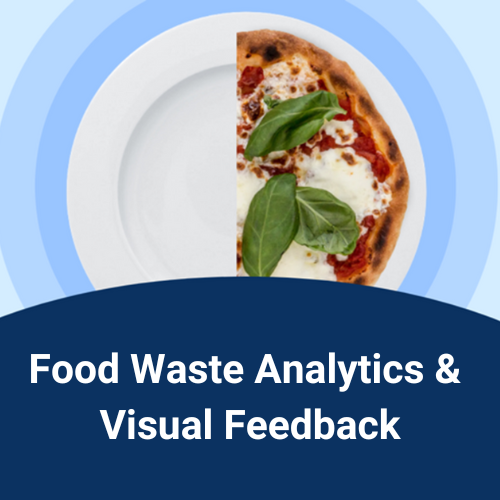
In 2018, a pressing issue emerged at the campus canteen: food waste. With trays piling up with uneaten food, the question loomed: "With all the technology available to us, can we curb food waste on campus?"
Interested in doing text analysis but daunted about where to start? Fear not! Two new library resources, Gale Digital Scholar Lab and Constellate, offer tools, data resources, and user-friendly interfaces to help you begin.
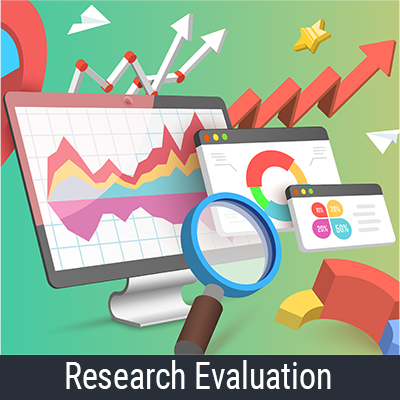
Research evaluation measures research quality in several dimensions, such as research projects, researchers, institutions, research output and impact, and more.
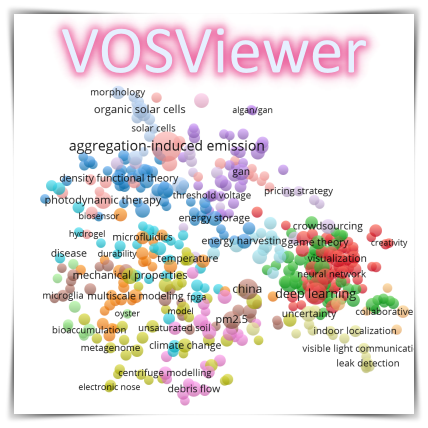
VOSviewer is a popular software that visualizes connections between research works. You can use it to create networks of term co-occurrence. Here is a very good training video that guides you to do that.
