




Using AI to Create Scientific Figures Responsibly

A scientific figure can explain ideas intuitively that might take paragraphs to describe. Researchers often plot graphs in R, Python, or GraphPad Prism, or arrange panels and labels in Adobe Illustrator.
Preparing scientific figures takes time, online illustration tools now offer additional ways to support this work, some even with “AI-assisted” features. Examples include Canva, FigureLabs, Illustrae, GPAI Visualizer, BioRender, and many others.
AI could help with many tasks, such as generating a concept diagram, drafting code to plot data, or editing an image. The risks depend on what the figure represents. An inaccurate diagram may mislead readers about a concept, while changes to an experimental image may misrepresent what was observed.
This raises a practical question: How can researchers use AI responsibly when preparing different types of scientific figures?
First Decide What the Figure Represents
A useful starting point is the figure’s purpose. Does it explain an idea, present an analysis or document an observation? The same figure may do all three. For this article, I use three broad categories informed by publishers' guidance and adapted from Koo and Lu’s proposed framework [1], [2]
- Concept or Explanation. Pathways, mechanisms, workflows and graphical abstracts explain ideas or processes. Use PowerPoint, Adobe Illustrator or Inkscape when you need full control over labels and shapes, while BioRender provides editable scientific icons. FigureLabs, Illustrae and GPAI Visualizer can help create an initial illustration from a description or sketch. Whatever tool you use, check the generated labels and structure, and make sure it doesn’t include false information or create something that didn't exist.
- Data or Analysis. Graphs, maps and heatmaps present results derived from data. Tools such as R, Python, GraphPad Prism, Power BI, and Tableau can analyse data and create figures. AI features may help draft plotting code, suggest a graph type or improve the layout, but the figure must represent the underlying data. Check the code, calculations, axes, units, legends, statistical assumptions and sample sizes. Keep the data and relevant code so others can trace and repeat the analysis [3].
- Observed Evidence. Microscopy images, western blots, gels, medical scans and experimental photographs record what an instrument or camera observed. Use the established image processing software. This may include cropping, applying the same brightness or contrast adjustment to the whole image, adding a scale bar or arranging labelled panels. Preserve the original files and document important changes. DO NOT use generative tools to add, remove or reconstruct experimental features [2], [4], [5].
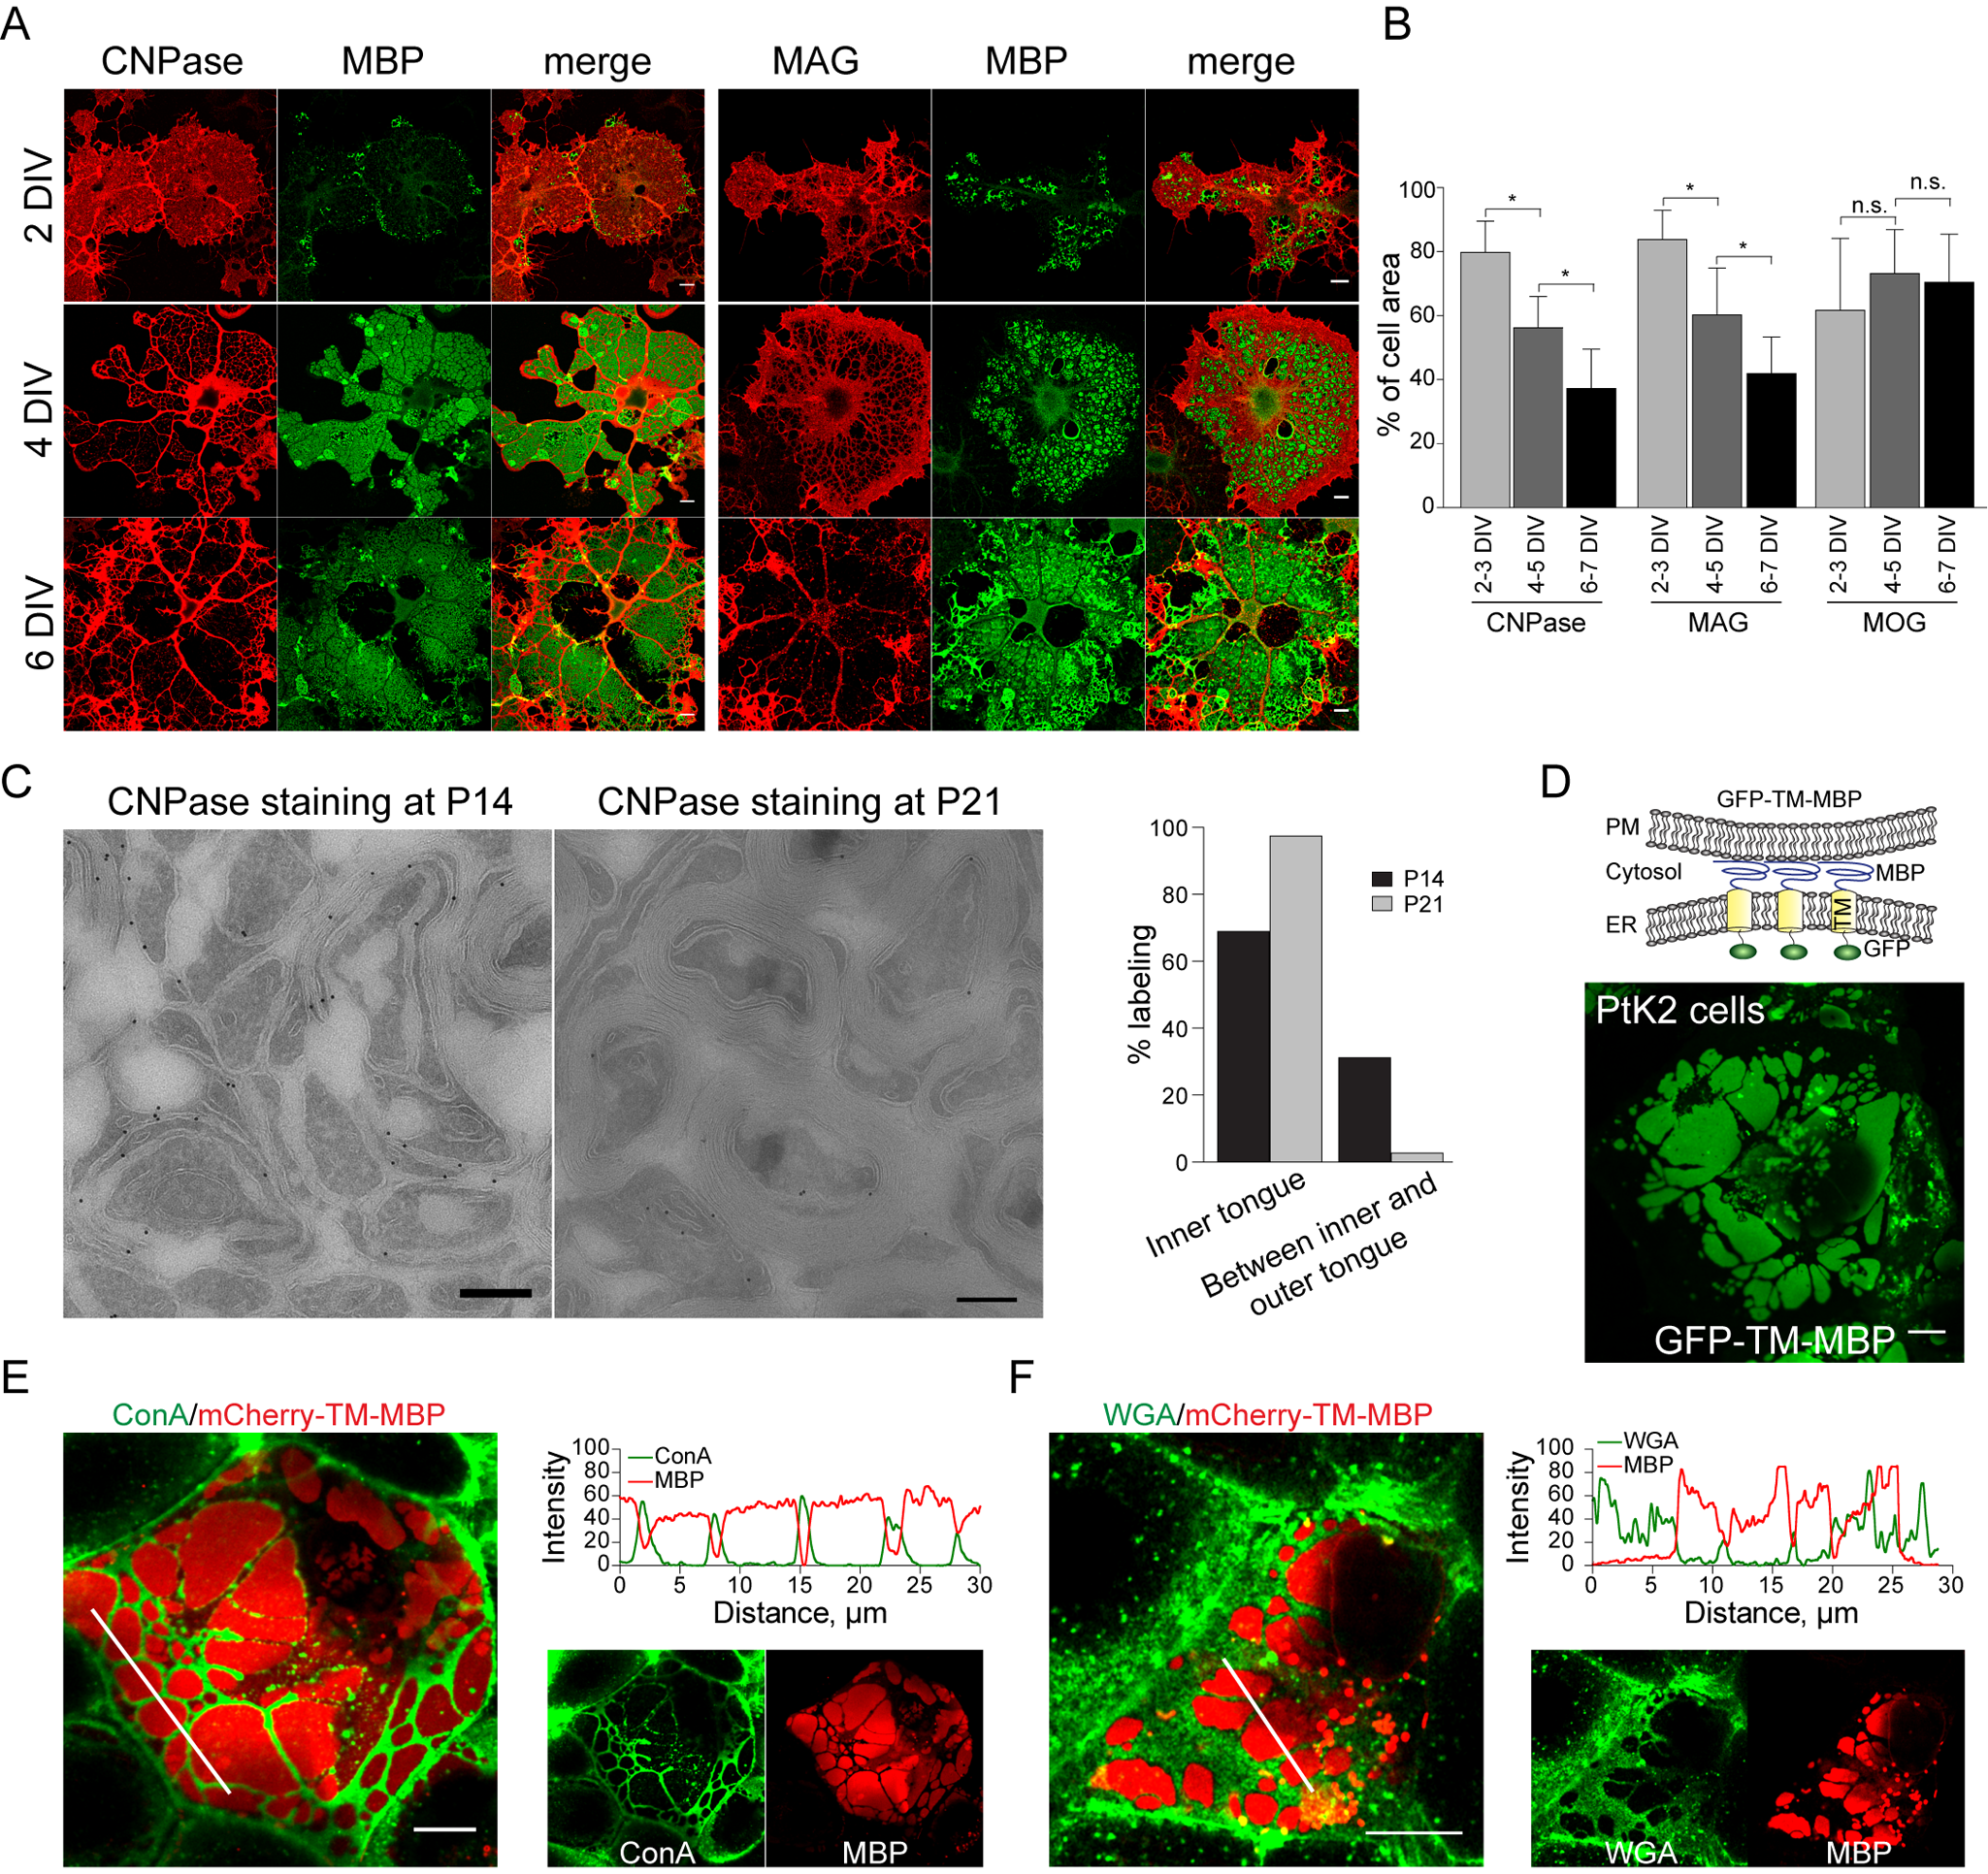
These categories can overlap. In the example below [6], Panel A presents Observed Evidence through microscopy images, while Panel B presents Data or Analysis by quantifying the percentage of cell area occupied by the indicated proteins. Panel C combines images with quantification, illustrating how observation and analysis can appear within the same panel.
Different purposes may require different tools. Microscopy captured the experimental images, while ImageJ was used for image analysis and measurement. Among these panels, the upper part of Panel D is the most suitable for AI illustration tools because it explains a concept rather than presenting experimental evidence.
Using AI Graphics for Publication
Identifying the figure’s purpose helps you choose a tool, but publication introduces another question: does the target journal permit that particular use of AI? The answer depends on what the figure represents and how you created it.
A tool’s name alone cannot answer this question. The same tool may offer manual drawing, existing graphics, and generative AI features. What matters is the specific feature used, how it contributed to the figure, whether you have the necessary publication rights and whether the journal permits that use.
We checked the following policies on 14 October 2026. Policies change over time, so consult the current requirements before submission.
- Elsevier permits AI assistance for certain explanatory images, including workflows, decision trees and schematic illustrations. Explanatory-image use must be disclosed in the caption and the article’s general AI declaration. AI-assisted data visualisations are permitted when they are derived directly from underlying data through reproducible methods. AI must not be used to create or alter primary research images [2].
- Oxford University Press permits explanatory images and data visualisation with disclosure but prohibits creating or altering primary factual, scientific or technical images [7].
- Springer Nature follows a source-based approach. AI-assisted visual content may be acceptable when it is derived from verifiable data, computational outputs, attributable source material or content developed by the authors. Images without an independently verifiable basis are considered opaque and are not permitted [9].
- Wiley permits AI assistance with illustrations and data visualisations, subject to verification, disclosure, publication rights and editorial judgement. It prohibits AI-edited research photographs and AI creation or modification of factual or evidential images [8].
Individual journals may vary and impose additional restrictions. A tool’s licence and a journal’s editorial policy are also separate requirements. If your intended use is not clearly covered, contact the editorial office before submission.
Also check institutional requirements and the tool’s terms before uploading unpublished, confidential or identifiable material [2].
Once the intended use is permitted, the finished figure must meet the journal’s technical requirements for format, dimensions and resolution [10]. For example, Elsevier accepts Office files, EPS or PDF for certain graphics and TIFF or JPEG for pixel-based images [11]. Wiley prefers PDF for line art (including graphs, flowcharts, diagrams, scatter plots, etc.), and PNG or TIFF for images [12]. Additionally, Readability matters. Therefore, check labels at the final publication size and choose colours that readers with colour-vision differences can distinguish.
Examples from Published Articles
Published review articles provide concrete examples of how authors have used and disclosed AI assistance. The table below records the tools named in those articles and the roles reported by their authors.
| Tool | Published example | Figure example | Reported use |
|---|---|---|---|
| FigureLabs | Annals of Translational Medicine [13] |  | FigureLabs generated illustrations of light therapy, which were then edited in Inkscape. |
| Illustrae | Metabolites [14] |  | Figures explaining exercise-related glucose responses and nutritional strategies were created with Illustrae’s assistance. |
| GPAI | Cells [15] | 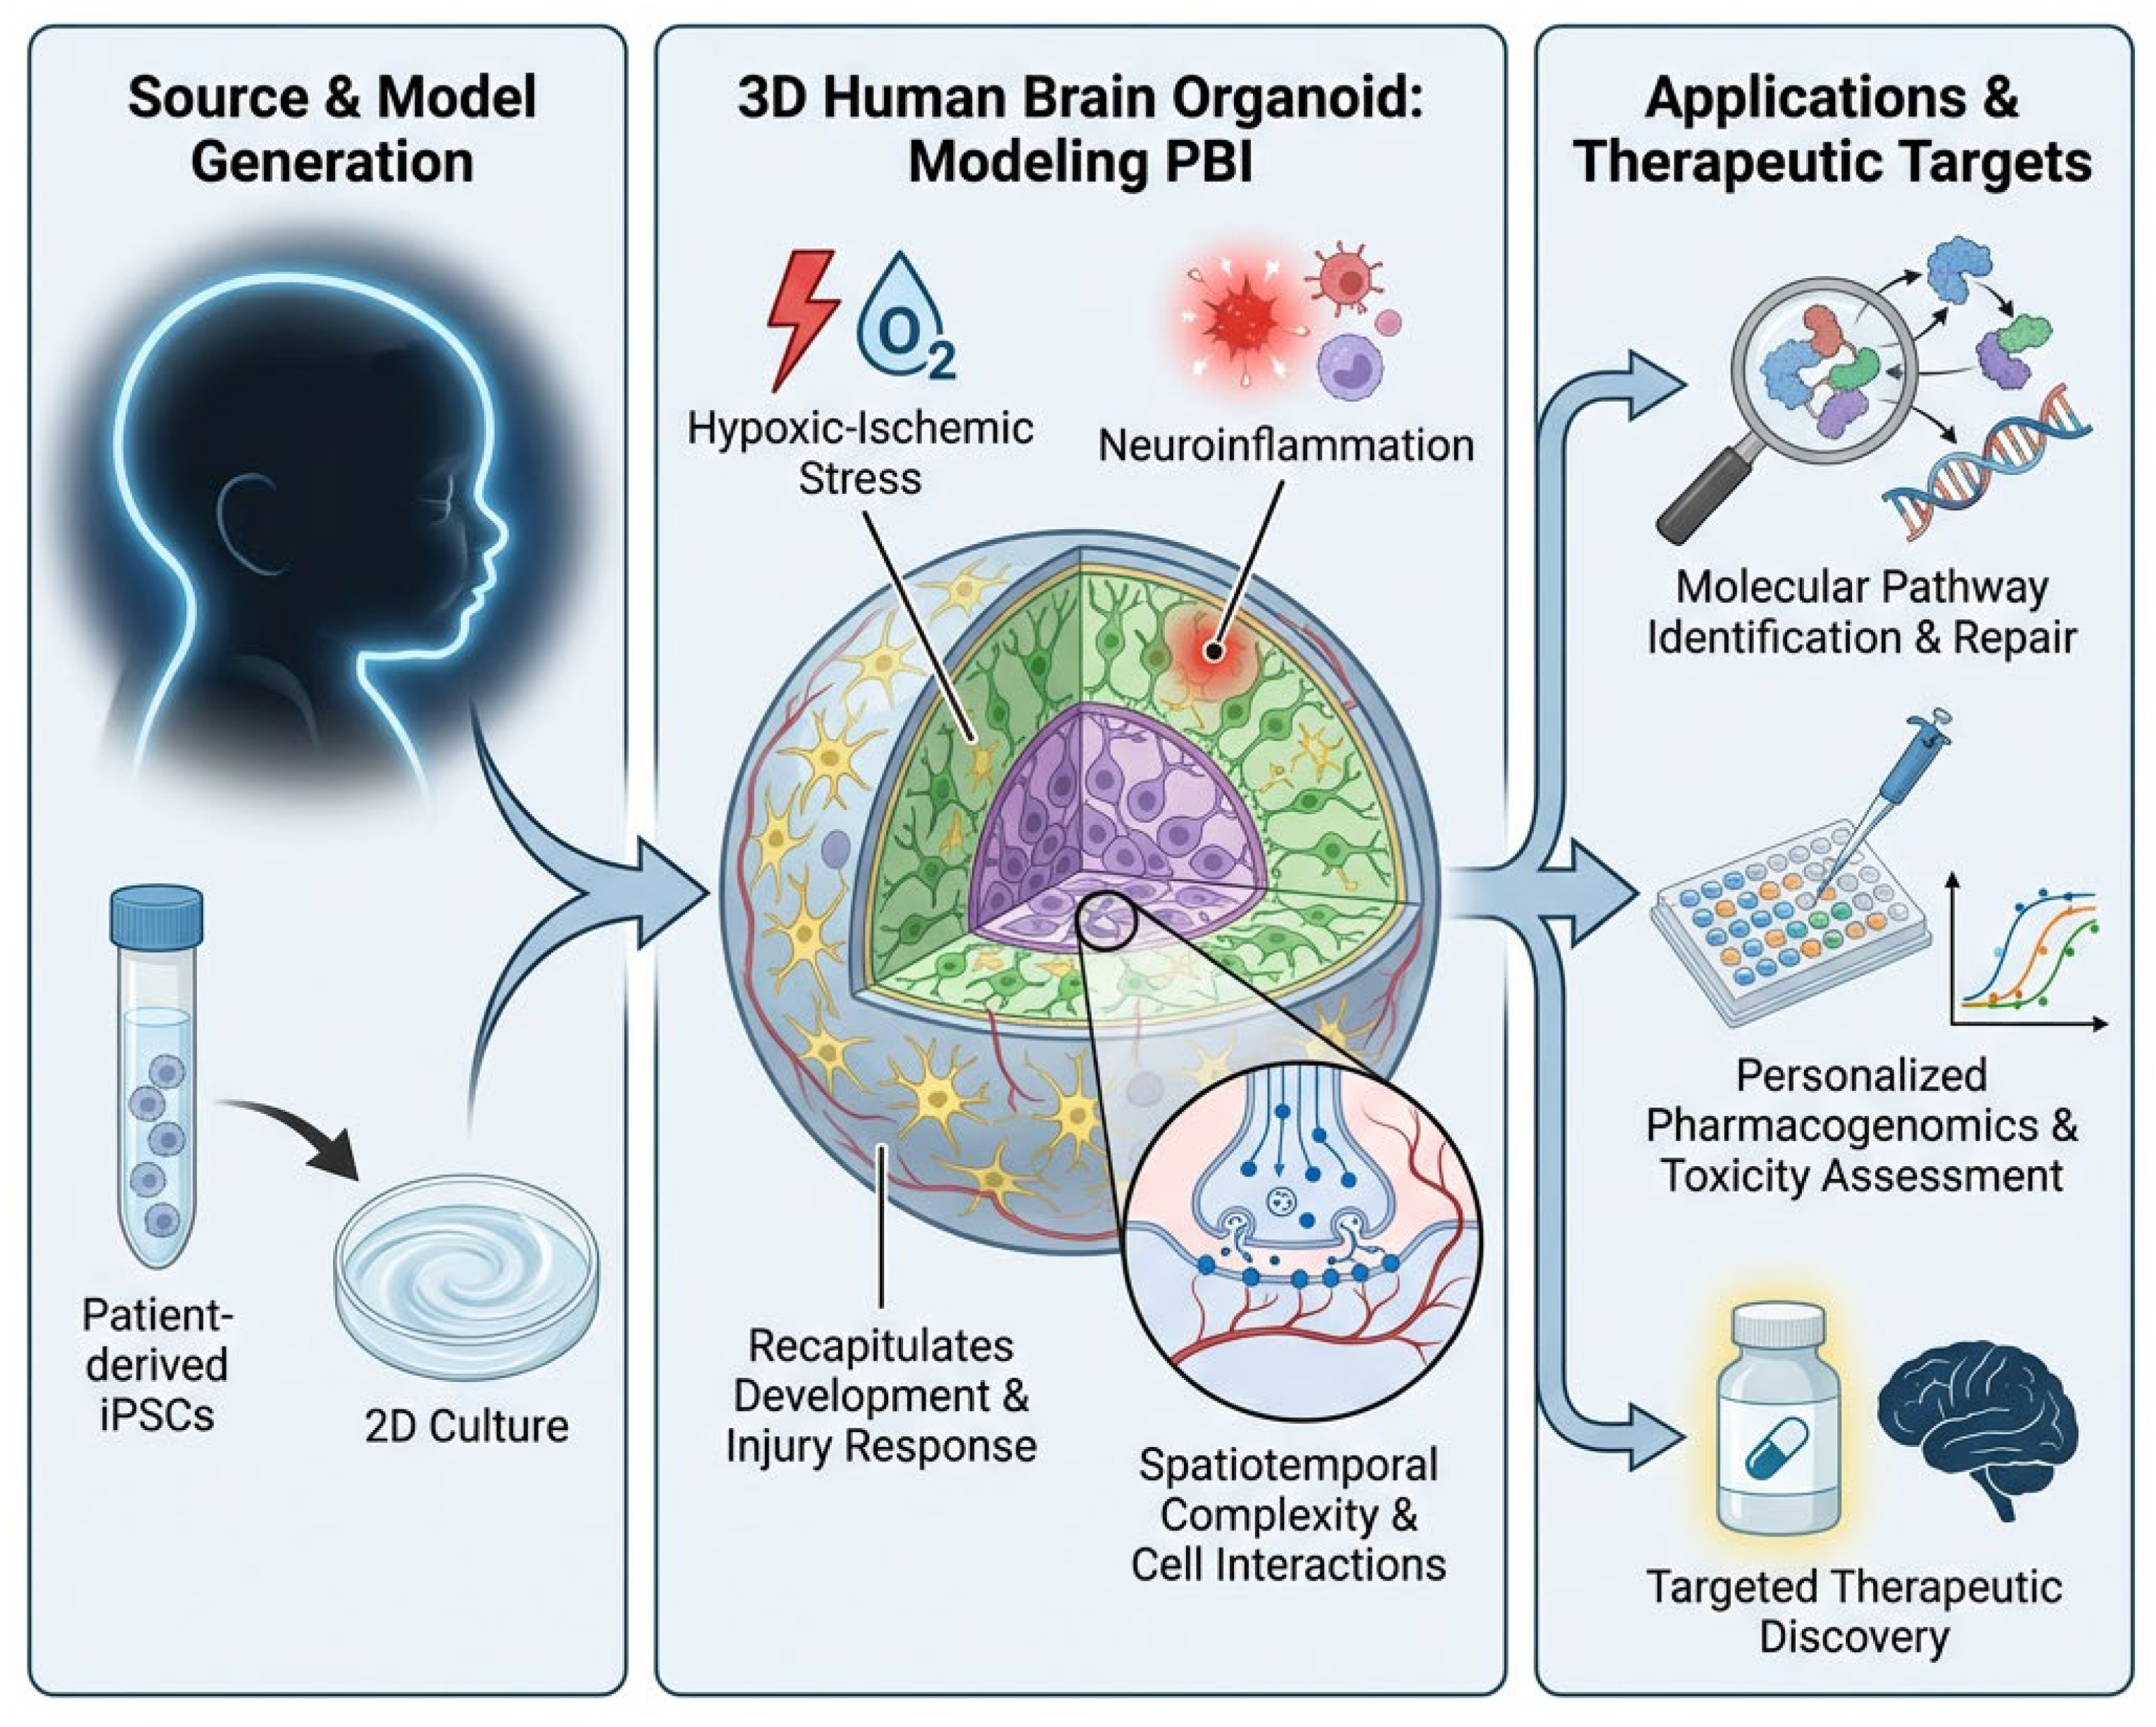 | The authors generated and reviewed a schematic of brain organoids in perinatal brain injury research with GPAI. |
The examples in the table are concept illustrations, not primary experimental evidence. They show how published articles report AI assistance, but they do not explain why editors accepted the figures or whether the tools improve accuracy or save time. Acceptance in one journal also does not guarantee acceptance elsewhere.
Visual Quality does not guarantee scientific accuracy
These examples show published uses of AI, but disclosure alone doesn't guarantee accuracy. On 5 December 2025, Scientific Reports retracted a paper on explainable AI for autism diagnosis after a post-publication investigation found that Figure 1 was AI-generated and contained nonsensical content. The editors also identified problems with the methodology description, code availability, and datasets [16]. The retraction raised concerns beyond the figure and illustrates why visual quality must be paired with a check of scientific meaning.
The Takeaway Message
AI can speed up some parts of scientific figure creation, but its value depends on whether the result accurately communicates the research. A simple figure backed by solid evidence, and that can be checked and explained, may be more useful than an impressive-looking image whose scientific details cannot be verified.
Before submission, return to three questions:
- What does the figure represent: a concept, an analysis or an observation?
- Is the selected tool appropriate for that purpose and permitted by the target journal?
- Can you check and explain every important part of the finished figure?
Keep the original data, images, code and editable files. Check publication rights and attribution requirements, then export the figure in the format and dimensions the journal requires. Disclose meaningful AI involvement in all required locations, which may include the caption, Methods section and a general AI declaration. Where required, name the tool or model, give its version or access date, explain its role and describe your review of the output.
Finally, AI can assist with drawing, coding, and layout, authors must check, revise and validate the final figure.
Disclosure of AI use. This article was written with assistance from Scite and Consensus MCP for literature searching and source checking, and ChatGPT for drafting and language editing.
References
[1] M. Koo and M. Lu, “AI ‐Assisted Scientific Figures in Scholarly Publishing: A Risk‐Based Taxonomy by Evidentiary Function,” Learned Publishing, vol. 39, no. 3, p. e2085, Jul. 2026, doi: 10.1002/leap.2085.
[2] Elsevier, “Generative AI policies for journals,” www.elsevier.com. Accessed: Oct. 14, 2026. [Online]. Available: https://www.elsevier.com/about/policies-and-standards/generative-ai-policies-for-journals
[3] J. P. Schessner, E. Voytik, and I. Bludau, “A practical guide to interpreting and generating bottom‐up proteomics data visualizations,” Proteomics, vol. 22, no. 8, p. 2100103, Apr. 2022, doi: 10.1002/pmic.202100103.
[4] Nature Porfolio, “Image integrity and standards | Nature Portfolio.” Accessed: Oct. 14, 2026. [Online]. Available: https://www-nature-com.lib.ezproxy.hkust.edu.hk/nature-portfolio/editorial-policies/image-integrity
[5] K. Miura and S. F Nørrelykke, “Reproducible image handling and analysis,” EMBO J, vol. 40, no. 3, p. EMBJ2020105889, Feb. 2021, doi: 10.15252/embj.2020105889.
[6] S. Aggarwal et al., “Myelin Membrane Assembly Is Driven by a Phase Transition of Myelin Basic Proteins Into a Cohesive Protein Meshwork,” PLoS Biol, vol. 11, no. 6, p. e1001577, Jun. 2013, doi: 10.1371/journal.pbio.1001577.
[7] Oxford University Press, “Policy on AI Use & Disclosure for OUP Journals Authors | Oxford Academic.” Accessed: Oct. 14, 2026. [Online]. Available: https://academic.oup.com/pages/for-authors/journals/preparing-and-submitting-your-manuscript/ai-principles-for-oxford-journals/policy-on-ai-use-and-disclosure-for-oxford-journals-authors
[8] Wiley, “Using AI tools in your research.” Accessed: Oct. 14, 2026. [Online]. Available: https://www.wiley.com/publishing/article/ai-guidelines
[9] Springer Nature, “AI Use in Manuscript Preparation | Policies | Springer Nature.” Accessed: Oct. 14, 2026. [Online]. Available: https://www-springernature-com.lib.ezproxy.hkust.edu.hk/gp/policies/editorial-policies/ai-manuscript-preparation
[10] R. Murphy, “Choosing the Right File Format for Journal Figures - Enago Articles.” Accessed: Oct. 14, 2026. [Online]. Available: https://www.enago.com/articles/journal-figure-file-formats/
[11] Elsevier, “Artwork overview | Elsevier policy,” www.elsevier.com. Accessed: Oct. 14, 2026. [Online]. Available: https://www.elsevier.com/about/policies-and-standards/author/artwork-and-media-instructions/artwork-overview
[12] Wiley, “Guidelines for Preparing Figures.” Accessed: Oct. 14, 2026. [Online]. Available: https://authors.wiley.com/author-resources/Journal-Authors/Prepare/manuscript-preparation-guidelines.html/figure-preparation.html
[13] Y. Oyama, A. Witowski, M. Adamzik, K. Bartels, and T. De La Garza Eckle, “Light therapy in medicine: where do we stand?,” Ann Transl Med, vol. 14, no. 3, pp. 35–35, Jun. 2026, doi: 10.21037/atm-2026-0041.
[14] D. Victoria-Montesinos, I. Llopis-Alonso, A. M. García-Muñoz, and M. T. Mercader-Ros, “Metabolic Responses to Exercise and Nutritional Strategies in Type 1 Diabetes Using Automated Insulin Delivery Systems: A Narrative Review,” Metabolites, vol. 16, no. 7, p. 437, Jun. 2026, doi: 10.3390/metabo16070437.
[15] A. Harej Hrkać, A. Pelčić, S. Mežnarić, J. Mršić-Pelčić, and K. Pilipović, “From Brain Organoids to Translational Neurology: Exploring Neuroprotective Targets and Molecular Approaches in Perinatal Brain Injury,” Cells, vol. 15, no. 5, p. 462, Mar. 2026, doi: 10.3390/cells15050462.
[16] S. Jiang, “Retraction Note: Bridging the gap: explainable ai for autism diagnosis and parental support with TabPFNMix and SHAP,” Sci Rep, vol. 15, no. 1, p. 43184, Dec. 2025, doi: 10.1038/s41598-025-31337-y.


