


Research Bridge

Research Bridge
9
11
16
Can AI assist non-coding humanities researchers in processing non-Western language materials? Yes—but this report shows how and why MLLMs fail on domain-specific OCR, what that reveals about their cognitive boundaries, and methodological implications for low-resource AI-assisted DH workflows.
AI in Research & LearningDigital Humanities
Research Bridge
Research Bridge
4
5
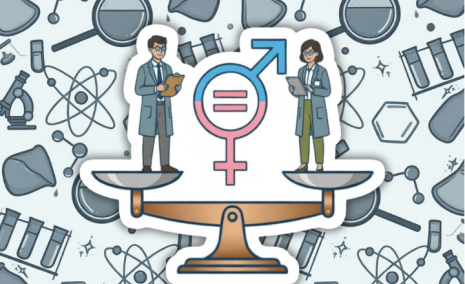
Growing up, I was surrounded by remarkable women —my mother, my teachers, and later my colleagues, I have always been nurtured and inspired by these “wonder women”, whose intelligence and resilience became the guiding lights along my path. Over time, that experience led me to a broader question: can we meaningfully capture and measure the contributions made by women in academia?
Academic PublishingHKUST Research
Research Bridge
Research Bridge
4
Discover Prism, a newly launched AI-native LaTeX editor by OpenAI that offers researchers a powerful, completely free alternative to Overleaf.
AI in Research & LearningResearch Tools
Research Bridge
Research Bridge
4
9
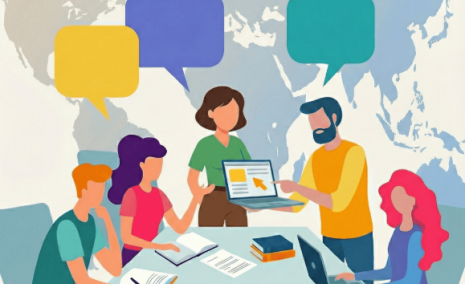
Research collaboration is often seen as a driver of growth—sparking new ideas, broadening perspectives, and strengthening institutions through shared expertise.
Evaluation and RankingHKUST Research
Research Bridge
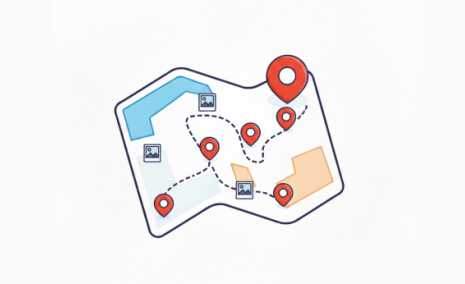
Instantly map photos with ArcGIS to uncover spatial patterns in your research.
Digital HumanitiesResearch Tools
