
For the first time, NSF S&E Indicator 2018 report showed that China has overtaken the U.S. in the total number of S&E research publications in 2016. The State of U.S. Science and Engineering 2020 report reveals an even bigger gap.
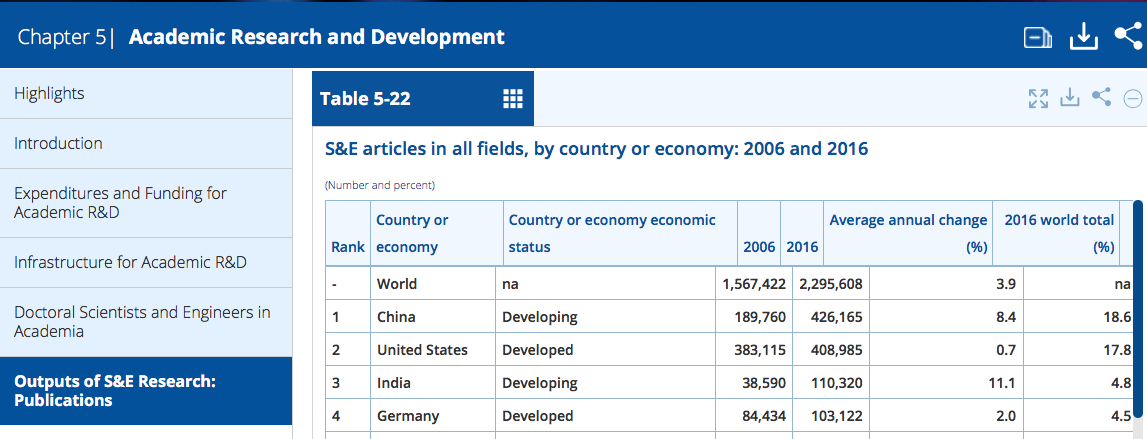
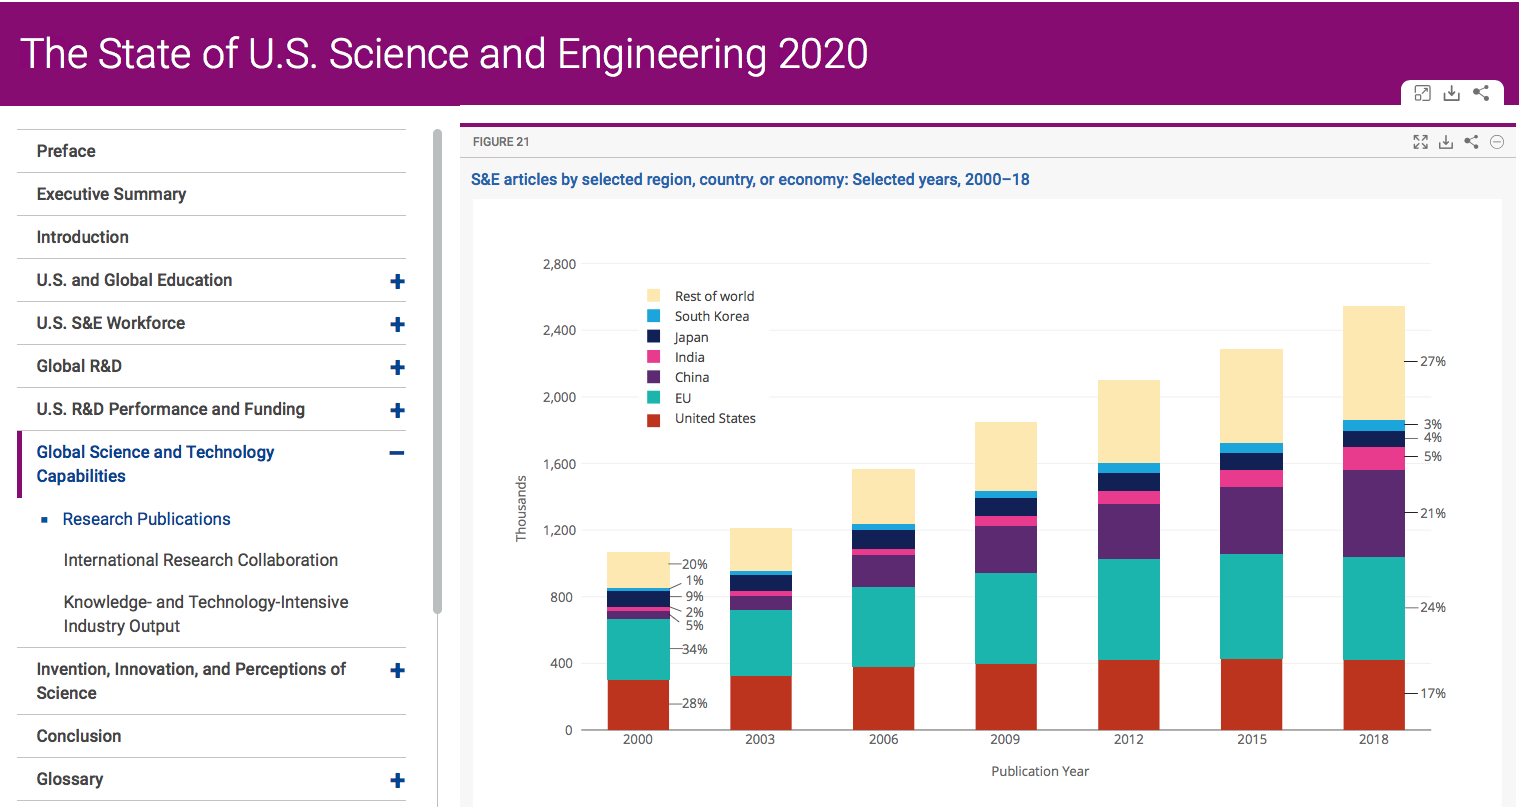
China’s share of world S&E publications has gone up from 18.6% in 2016 to 21% in 2018, ranks second to the EU.
OTHER INDICATORS
A country’s scientific strength should not be measured solely by one factor, the other indicators in this section are also highly relevant and worth noting.
Top 1% cited article index, by selected region, country, or economy: 2000–16
The index is based on a country’s global share of top articles and its global share of all publication outputs. It can be viewed as a measurement of the impact of a country’s research. The U.S. scored the highest ratio of 1.88 among all, the EU 1.30 and China 1.12. They are also the top three in number of articles published, but the order is different.
International collaboration on S&E articles, for the 15 largest producers of S&E articles, by country or economy: 2018
International collaboration is considered as an important indicator because it can enhance research capability via sharing of experience and views across a broad spectrum. Countries that collaborated most internationally are the UK (62%), Australia (60%), and France (59%).
Another interesting finding is that U.S. authors most frequently collaborate with authors from China, which took up 26% of the U.S. total internationally coauthored articles.
Value-added output of high R&D intensive industries by selected region, country, or economy: Selected years, 2003–18
Based on the R&D intensity, i.e. the ratio of R&D expenditure to GDP, several industries have been identified in the report as high R&D intensive globally, such as manufacturing of aircraft; pharmaceutical; computer; electronic, etc. U.S. took a strong lead in global share (32%), followed by China (21%) and the EU (19%).
Value-added output of medium-high R&D intensive industries by selected region, country, or economy: Selected years, 2003–18
Examples of medium-high R&D intensive industries are chemical (excluding pharmaceutics), electrical and other machinery and equipment, information technology services, and scientific instruments. In this area, China’s global share was the highest (26%), the EU came second (23%) and the U.S. in the third place (22%).
Source of Information
The Science & Engineering Indicators (Indicators) report is prepared by the National Centre for Science and Engineering Statistics (NCSES) under the National Science Funder (NSF) of the United States. The 2020 edition of the Indicators will be published as a series of streamlined reports consisting nine thematic reports from the fall of 2019. The State of U.S. Science and Engineering 2020 report provides highlights of the key findings in the Indicators.
Explore the NCSES website for more informative and interesting findings.
References
Science & Engineering Indicators 2018.
The State of U.S. Science and Engineering 2020.
— By Poon Sau Ping, Research Support Services, Library
Views: 3415
Go Back to page Top
- Category:
- Evaluation and Ranking
Tags: NSF, publishing, R&D intensity
published March 2, 2020
last modified March 11, 2022