


Visualizing HKUST Research Collaboration by VOSviewer
Last week, we briefly introduced a number of visualization tools for citation network. In this post, we will demonstrate how to use VOSviewer to create a bibliometric visualization for HKUST research network. In particular, we would like to explore our research collaborators and their citation impact.
Research Collaborators
Collaboration in research is a growing trend, and it brings a lot of benefits like higher impact on citation. In order to identify top collaborators with HKUST, we extracted the citation data from Web of Science database. Other citation-tracking databases like Scopus, Microsoft Academic and Dimensions can also be used as the data source. For the sake of simplicity, we searched for HKUST documents published in the last 5 years (2016-2020) in Web of Science. This profile, although not exhaustive, created a comprehensive number of documents for this demonstration.
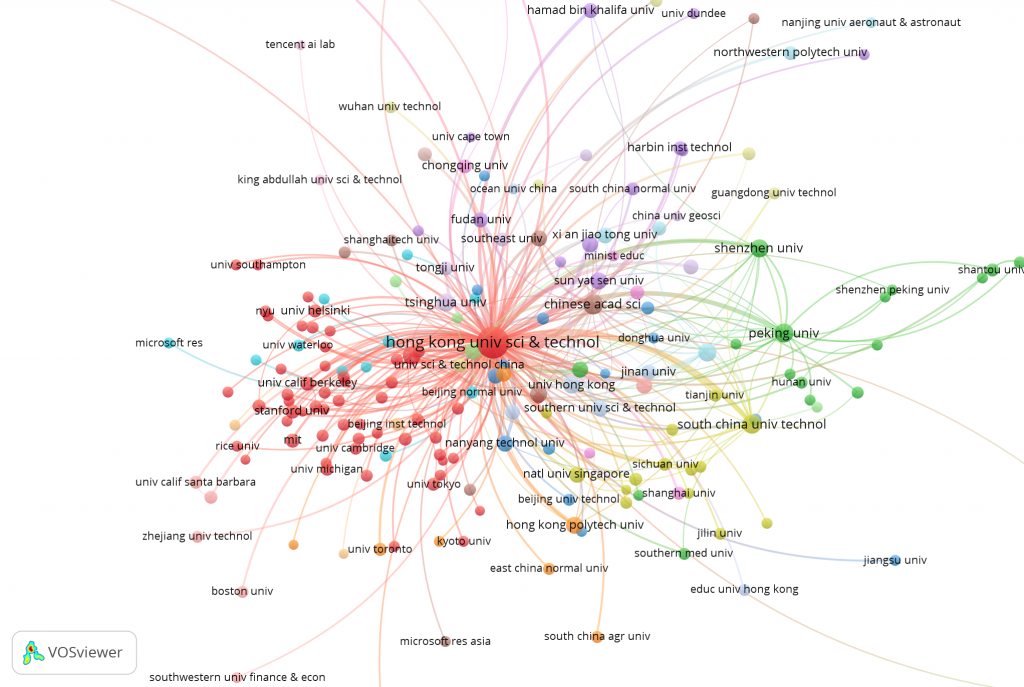
Data was collected in mid-February. A total of 13,378 HKUST-affiliated documents were identified in WOS between 2016 and 2020 which included 10,551 (78.87%) articles, 2,054 (15.35%) conference papers, 390 (2.92%) review articles and 383 (2.86%) other forms of documents (e.g. meeting abstracts, book reviews, editorial materials, etc). To get a general view of our collaborators, we created a co-authorship network in VOSviewer. A maximum number of 200 organizations per document was set to ignore publications co-authored by a large number of organizations. A threshold of 20 documents of an organization was also selected, and 193 (out of 4050) organizations met the threshold.
The below visualization presented the co-authorship network of HKUST. Each node represented an institution; the size of a node indicated the number of publications of the institutions. Line indicated the co-authorship links between institutions. Colors designated clusters of organizations that were strongly connected to each other by co-authorship links. We noted that the Chinese Academy of Sciences, Tsinghua University, South China University of Technology and the Chinese University of Hong Kong are the most productive collaborators over the last 5 years; some corporate collaborators including Tencent AI Lab and Microsoft were also identified in the visualization network.
Citation Impact
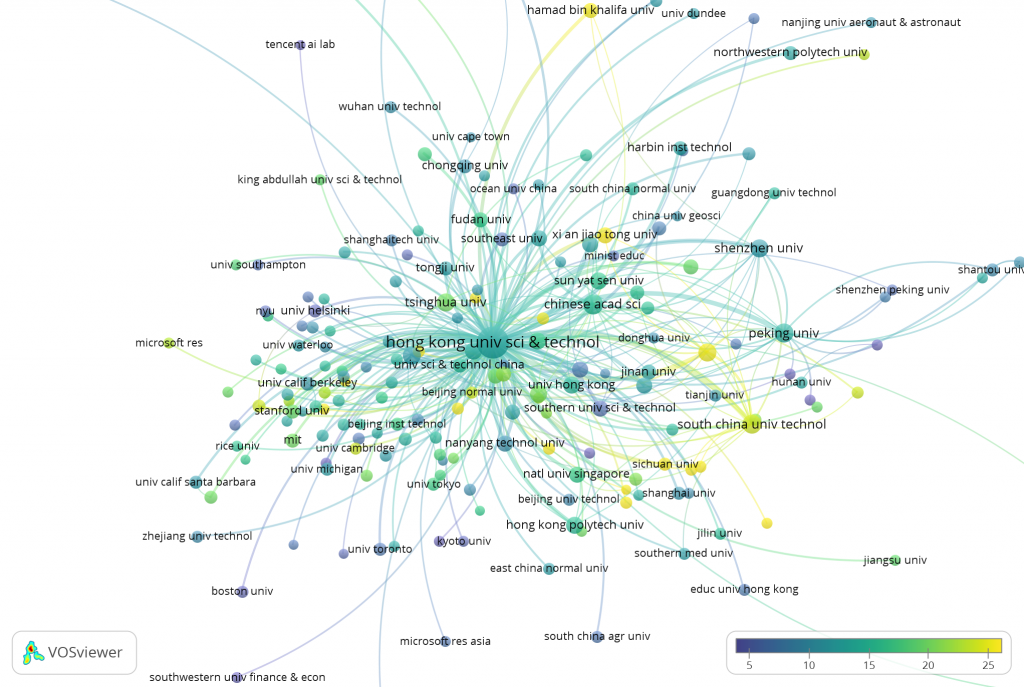
We are often interested in citation which provides an approximate measure of scientific impact. This overlay visualization identified the citation impact of HKUST publications with different collaborators. The overlay colour of each node corresponded to the average citation count, and the size of the node represented the number of publications. In this map, collaborators coloured in yellow indicated a higher average number of citations compared to collaborators coloured in blue. High-impact collaborators included Xian Jiaotong University, North Carolina State University, Georgia Institute of Technology, South China University of Technology, Hamad Bin Khalifa University, Argonne National Laboratory, Imperial College of London, etc.
VOSviewer is a powerful tool for visualizing citation data. It can also be used to create a term co-occurrence map based on text data. Feel free to download our sample data (HKUST members only) and try it out on VOSviewer. To learn more about its applications and other use cases, see these readings:
- Ranjbar-Sahraei, B., and Negenborn, R.R. (2017). Research positioning & trend identification. Retrieved from http://aida.tudelft.nl/toolbox/aida-booklet.
- Van Eck, N., and Waltman, L. (2017, October 23). Visualizing freely available citation data using VOSviewer [Blog post]. Retrieved from https://www.cwts.nl/blog?article=n-r2r294.
- Van Eck, N., and Waltman, L. (2020). VOSviewer Manual. Retrieved from https://www.vosviewer.com/documentation/Manual_VOSviewer_1.6.15.pdf.
