Exploring the research landscape of an institution has often meant turning to traditional academic databases like Web of Science or Scopus for publication information. However, open data is changing how we understand research. In this post, we will demonstrate how we use OpenAlex, a large and open database of scholarly data, to draw insights from our research contributions.
OpenAlex - What & Why
OpenAlex is a free and completely open database of publication data. We introduced this platform back in early 2022 when it was just launched. Since then, the database has grown significantly, including recently the release of a user-friendly interface that allows everyone to interact with the data without technical limitations.
Currently, OpenAlex contains about 248 million records, which is more than twice of the data in Scopus or Web of Science Core Collection (Figure 1). At source level, OpenAlex has a much broader coverage of journals (over 64,000), particularly in the fields of humanities and non-English language research. The extensive coverage and accessibility of the data allow for a more transparent and comprehensive analysis of institutional research.
Figure 1. Coverage of OpenAlex, in comparison with Google Scholar, Scopus and Web of Science. (Journal coverage in Google Scholar is unclear.)
Access data in OpenAlex
In brief, there are three ways to access data in OpenAlex:
- through bulk download:: As a completely open database, technically you can download a snapshot of the entire dataset in OpenAlex.
- through user interface: Recently significantly improved, though there are still some technical limitations regarding filter types and the data download.
- through API: Most recommended due to its flexibility and generous daily limit (100,000 requests per user). The file format is JSON Lines.
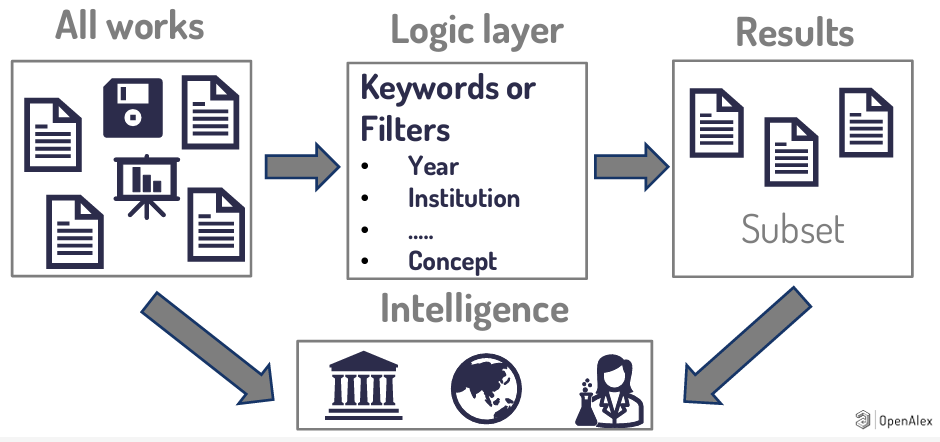
OpenAlex is essentially a large catalogue of scholarly works. To understand an institution’s research, a typical workflow of using its data is to start with all works, use filters or keywords to create a subset of works, and then generate insights or “intelligence” from this subset (as illustrated in Figure 2). For example, to examine an institution’s progress towards open access, we could first identify all works from that institution, then filter by OA status, and finally group the results by year.

Figure 2. How OpenAlex works. Source: Introducing OpenAlex: An open, comprehensive index of scholarship.https://openalex.org/Intro_OpenAlex.pdf
In this post, we will look into 10 years of publication data from HKUST using OpenAlex API. We will use four interactive charts to address four questions researchers or administrators might be interested:
- Scenario 1: How is our progress towards open access?
- Scenario 2: Which journals have we published in the most over the last 10 years?
- Scenario 3: How has our contribution to the Sustainable Development Goals (SDG) evolved over the years?
- Scenario 4: Which of our publications have had the most impact over the years?
Using OpenAlex data to understand HKUST’s research
All data were extracted on January 30 and 31, 2024, using the OpenAlex API. The code for data collection and cleaning is available on GitHub. Charts were created on Flourish.
S1: How are we progressing toward open access?
- This line chart shows the 10-year trend of open access (OA) publications by HKUST authors, differentiated by OA types:
- “Gold (APC)” refers to articles published in full OA journals (listed in DOAJ) that require an Article Processing Charge (APC). This includes articles with discounted fees.
- “Diamond” refers to articles published in full OA journals without an APC.
- “Hybrid” refers to freely available articles under OA license (e.g. CC license) published in subscription-based journals.
- “Bronze” refers to freely available works without an identifiable license. This could potentially limit the reuse of these works.
- “Green only” refers to works (including conference papers) that are only available in an OA repository, such as arXiv and HKUST SPD.
Filters used for data extraction
is_oa- to determine OA and non-OA works (True if the work is OA)oa_status- to obtain OA status of works, namely gold, green, hybrid, bronze, closed- Diamond OA can be identified using a combination of
is_oa= True andapc_list.value= 0
Findings
The chart illustrates steady growth across all OA types until last year, when there was a significant drop in Green OA works and a slight decline in Gold OA involving APC. Interestingly, we note a sharp increase in Bronze OA (no license) and Diamond OA (no APC) publications. One of the main contributors of Bronze OA's change is Association for Computing Machinery (ACM). This is likely due to ACM’s commitment in 2023 to transition to 100% OA by the end of 2025..
Hybrid OA articles continued to rise, with Wiley, ACS, and Cambridge University Press (CUP) journals being the major contributors in 2023. The change in CUP is likely related to the OA transformative agreement signed with the Library, which allows HKUST authors to publish OA articles in its Gold and Hybrid journals without fees. As more OA transformative agreements come into effect in 2024, including with major publishers like Wiley and SpringerNature, we expect more HKUST works to be published in OA going forward.
S2: Which journals have we published in the most over the last 10 years?
This running bar chart highlights the change in the top 20 journals that HKUST authors have published in over the last 10 years. Each bar corresponds to a journal, with the bar length indicating the number of articles published in that journal in a particular year. Color represents different publishers.
Filters used for data extraction
source_display_name- to obtain the titles of journals where the works are publishedhost_organization_name- to obtain publisher’s name of the journals
Findings
Overall, the timeline reveals a significant growth towards interdisciplinary fields such as IoT and AI, and a consistent interest in environmental sciences and engineering. Initially, journals from RSC (green bars) dominated the list. Around mid-decade, however, journals from Wiley (black) and ACS (yellow) gained prominence. Scientific Reports was once the most popular among HKUST authors, but Nature Communications later took the lead, especially from 2019 onwards. Most recently, IEEE journals started to top the list, with noticeable growth in IEEE Transactions on Knowledge and Data Engineering, IEEE Transactions on Wireless Communications, and IEEE Internet of Things Journal.
S3: How has our contribution to the Sustainable Development Goals (SDG) evolved over the years?
Works in OpenAlex are categorized under a Sustainable Development Goals (SDG) category to facilitate the SDG contribution analysis at institutional or regional level. This bar chart displays the Top 7 SDG areas where HKUST authors have published the most. The length of the bars represents the number of works in each SDG area for a specific year. Color follows the SDG’s color scheme. The data is arranged in descending order based on the total number of SDG-related works in 2023. You can pick one or more SDGs of interest from the top list to view their trend of publications.
Filters used for data extraction
sustainable_development_goals- to obtain the SDG areas related to the works
Findings
Over the past decade, the total number of publications in SDG areas has nearly doubled. The Top 7 SDG areas that HKUST publications focus on are:
- Affordable and Clean Energy
- Sustainable Cities and Communities
- Industry, Innovation, and Infrastructure
- Life Below Water
- Good Health and Well-being
- Clean Water and Sanitation
- Peace, Justice, and Strong Institutions
“Affordable and Clean Energy” has consistently seen the highest number of publications, indicating a strong and growing interest in energy-related research at HKUST. We also observed a significant increase in publications related to “Good Health and Well-being” after 2020. This could be a response to the COVID-19 pandemic, highlighting the intensified research focus on health issues.
S4: Which of our publications have had the most impact over the years?
This slope chart provides yearly citation counts for HKUST publications from 2014 to 2023, allowing for analysis of how the influence of each publication has evolved over time based on citations received. Each line represents a different publication. By hovering over a line, you can see the title, journal, and link of the work, along with its yearly citation counts. You can also navigate to different years from the top to view influential works from that year.
To reduce the complexity of the plot, only works with more than 10 total citations (as of January 30, 2024) are included (14k publications out of the total 33.4k).
Filters used for data extraction
author_display_name- to obtain first author’s namepublication_year- to obtain the year of publicationtitle- to obtain the title of the articlesource_display_name- to obtain the titles of journals where the works are publisheddoi- to obtain the DOI of the articlecited_by_count- to obtain the total citations of each articlecounts_by_year- to obtain the citations of each article received in each year
Findings
The chart allows us to easily identify the leading works in each year and track their citation trends. For example, the two review articles mentioned below, both published in 2015, continue to gain high citations even 9 years after publication.
| 2015 | Aggregation-Induced Emission: Together We Shine, United We Soar! Chemical Reviews https://doi.org/10.1021/acs.chemrev.5b00263 |
| 2015 | Neuroinflammation in Alzheimer's disease The Lancet Neurology https://doi.org/10.1016/s1474-4422(15)70016-5 |
The chart also highlights publications that had an immediate citation impact, including:
| 2017 | A Survey on Mobile Edge Computing: The Communication Perspective IEEE Communications Surveys and Tutorials https://doi.org/10.1109/comst.2017.2745201 |
| 2018 | StarGAN: Unified Generative Adversarial Networks for Multi-domain Image-to-Image Translation Conference paper https://doi.org/10.1109/cvpr.2018.00916 |
| 2019 | Federated Machine Learning ACM Transactions on Intelligent Systems and Technology https://doi.org/10.1145/3298981 |
| 2020 | Aerodynamic analysis of SARS-CoV-2 in two Wuhan hospitals Nature https://doi.org/10.1038/s41586-020-2271-3 |
| 2021 | Non-fullerene acceptors with branched side chains and improved molecular packing to exceed 18% efficiency in organic solar cells Nature Energy https://doi.org/10.1038/s41560-021-00820-x |
| 2022 | A Survey on Multi-Task Learning IEEE Transactions on Knowledge and Data Engineering https://doi.org/10.1109/tkde.2021.3070203 |
| 2023 | Survey of Hallucination in Natural Language Generation ACM Computing Surveys https://doi.org/10.1145/3571730 |
Many of these publications are from high-impact journals such as Nature and its sister journals, Chemical Reviews, and The Lancet Neurology. It is also notable that the most cited paper in 2020 was on COVID-19, while in the recent two years, the focus has shifted to AI and machine learning.
Limitations
The dataset in OpenAlex includes publications from both the HKUST CWB and HKUST GZ campuses. We use ROR as an institutional identifier, and currently, the GZ campus shares the same ROR as CWB, which may affect the accuracy of attributing publications to the individual campus.
In our exploration of the OpenAlex dataset, a few inaccuracies were noted:
- APC list information, primarily sourced from DOAJ, may not be updated and only includes Gold OA journals, not Hybrid OA journals. OpenAlex does provide information on the actual APC paid, sourced from openAPC database. However, this primarily covers EU-based institutions. Both factors make it difficult to estimate the APC cost.
- Gold OA articles may be mistakenly tagged as Bronze OA due to missing license information. This misclassification could impact the accuracy of the analysis of OA articles. Note that OpenAlex uses Unpaywall for OA information, the same source as Scopus and Web of Science.
Conclusions
This post shows only four possibilities to explore OpenAlex, an open database of scholarly data, and there are many more possibilities to explore,, such as benchmarking or analyzing institutional collaborations. By using different visualizations, we can gain insights into various facets of institutional research, including publication trends in OA, citation impact, and alignment with global objectives like the SDGs. We hope this article will inspire more institutions to harness the potential of open data for research analysis, leading to a more transparent and comprehensive grasp of the research landscape.


