


Connected Papers: A Free Tool to Explore Research Papers
With Connected papers, you can explore papers in your research field using graphs. You may discover more papers than traditional literature searches.
This week we introduce a free discovery tool for researchers: Connected Papers. Traditional research databases use topics and keywords to find relevant papers. Using citation links is another popular way to trace works on the same field or related topics. In the past few years, new tools, such as scite, emerged that visualize citation links as graphs, making literature discovery more intuitive and interactive. Connected Papers also presents works in graphs; however, its graphs are not citation maps, but build upon connections using a similarity metric. That means, it may discover related papers that you do not find via keywords or citation searches!
Starting a Graph with One Paper
To start your exploration using Connected Papers, you need a "seed paper". Simply put the doi (Digital Object Identifier, a type of Persistent ID) of your seed at the front page:
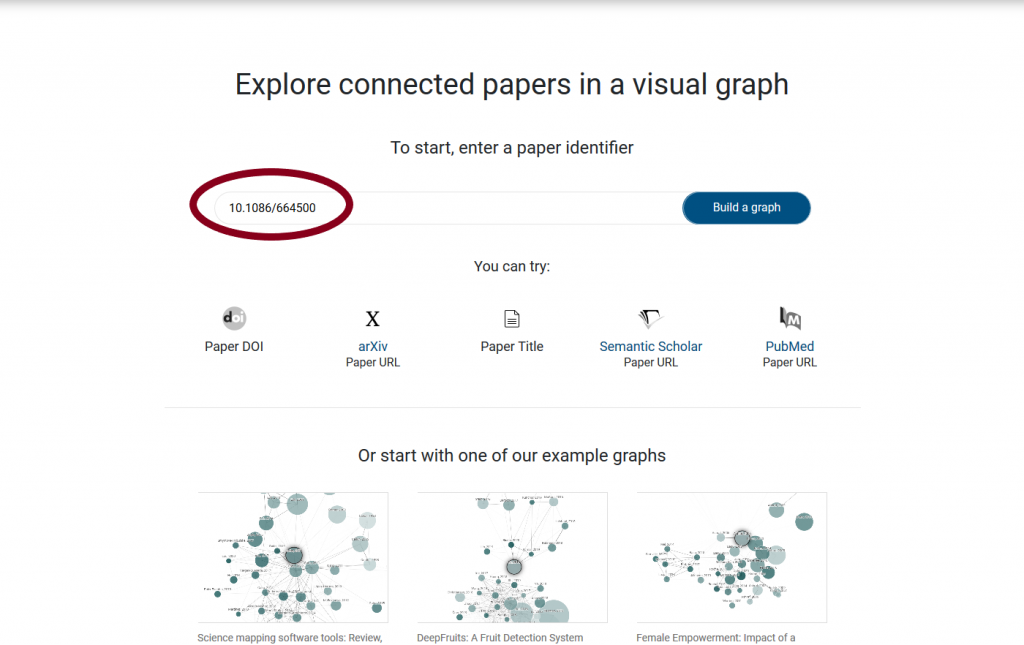
This example is a 2012 article by Prof. Dalton (MARK). Connected Papers built a graph that consisted of 40 similar papers. Only 5 papers in the graph were cited by the seed paper.
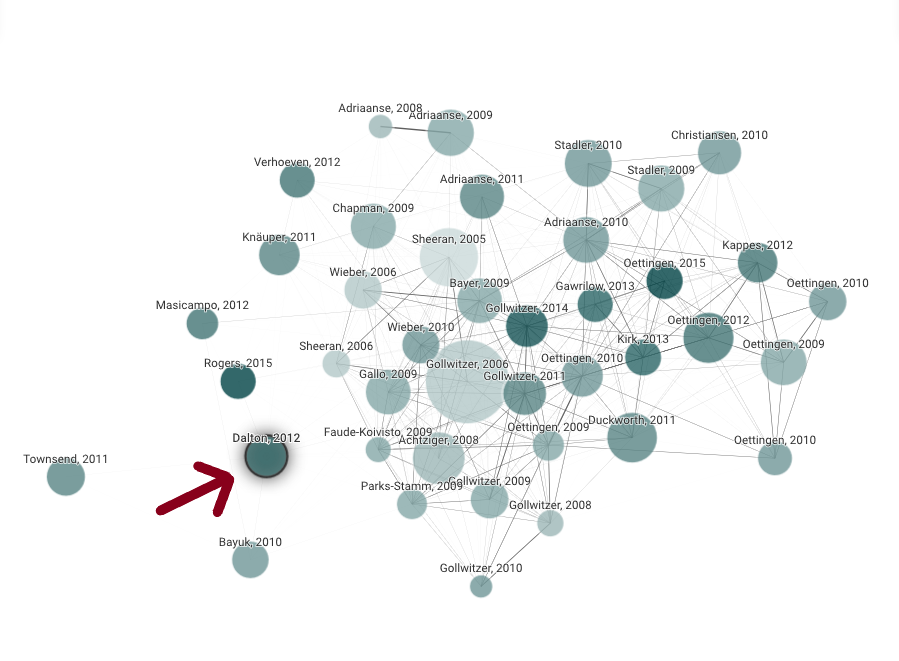
In the graph shown below. You can see the original paper marked. Each node is a related paper; node size is the number of citations. Color is the publication year; the lines and proximity represent similarity. You can explore the graph, paying attention to the visual elements such as:
- bigger nodes that represent highly-cited papers, e.g. "Gollwitzer, 2006"
- darker nodes, which are more recent works
- clusters of nodes that are close together, meaning that they are similar
- "outliners", such as "Townsend, 2011" or "Bayuk, 2010", which might carry an approach to the topic different from the rest of the group
Show Details of Other Papers
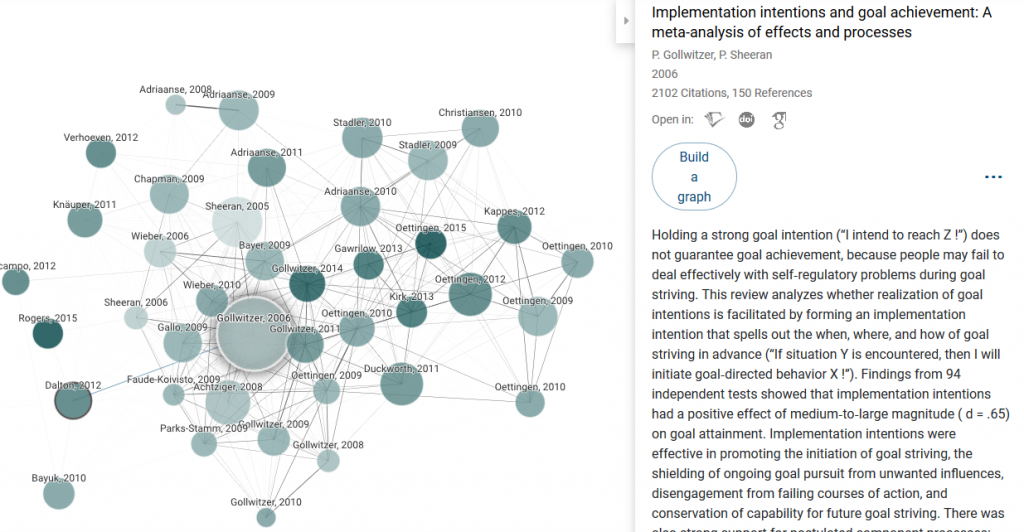
You can mouse over any node; the details of the corresponding paper is shown on the right panel. For example, this screen shot shows the information about "Gollwitzer, 2006"; you can build a new graph using it as a new seed:
Linking Backward and Forward in Time
Co-citation is one of the concepts that Connected Papers uses to calculate similarity. The two buttons at the top-left of the screen are useful to find older and later articles that have common citation relation with the papers in the graph.
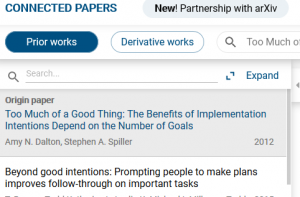
In this example, the "Prior works" set contains 10 papers, published from 1993 to 2007, that were most commonly cited by the papers in the graph. These are probably important works in the field. Using a similar idea, the "Derivative works" set contains 10 papers, published from 2010 to 2018, that cited many of the papers in the graph. These may be survey of the field (i.e. literature review), or recent works which were inspired by many papers in the graph.
Exporting the Lists
Apart from the Graph view, you can "Expand" to see the papers listed with more details. On the detail screen, you can use the "download" button to save the list of bibliography. There are options to directly import into citation managing software such as Zotero.
Summary
Connected Papers helps you explore literature in your field of research. You can easily generate graphs that pull out papers on similar topics. It is a handy tool that complements traditional database discovery using keywords and citation links. It is especially helpful when you are building your understanding for literature review.
