As researchers, we want to stay informed about recently published research and see who are citing our work. Here we demonstrate using Scite to create dashboard for tracking citations for a list of papers.
A Dashboard of HKUST Publications
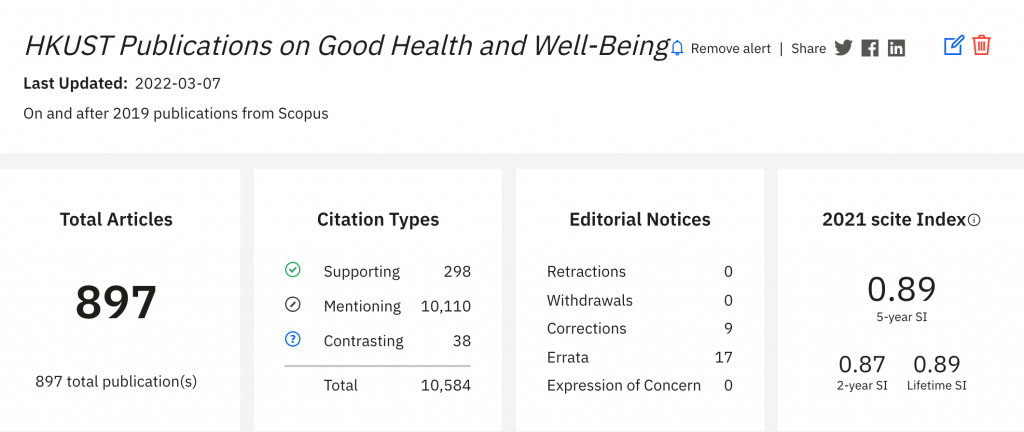
Interested to see how HKUST researchers contribute to “Good Health and Well-being” as one of UN’s Sustainable Development Goals (SDGs), for demonstration I imported a list of HKUST publications from 2019 related to this SDG goal from Scopus to Scite and created a dashboard. Here is how the dashboard looks like in Figure 1:

Figure 1. Dashboard key metrics
At a glance, we can quickly see key metrics such as:
- How many total supporting, contrasting, and mentioning citations they have received: One of the most distinctive features of Scite is that it aims to surface the intention of citations. It allows users to see where and how a publication has been cited by providing the context of the citation and a classification describing whether it provides supporting or contrasting evidence for the cited claim.
- How many editorial notices they have received: Editorial notices are vital for keeping readers informed of further updates and discussions arising of a publication after its release. Types of editorial notices include retractions, withdrawals, corrections, errata, and expression of concern. It’s great to see that there is no retraction nor withdrawal for our list of papers.
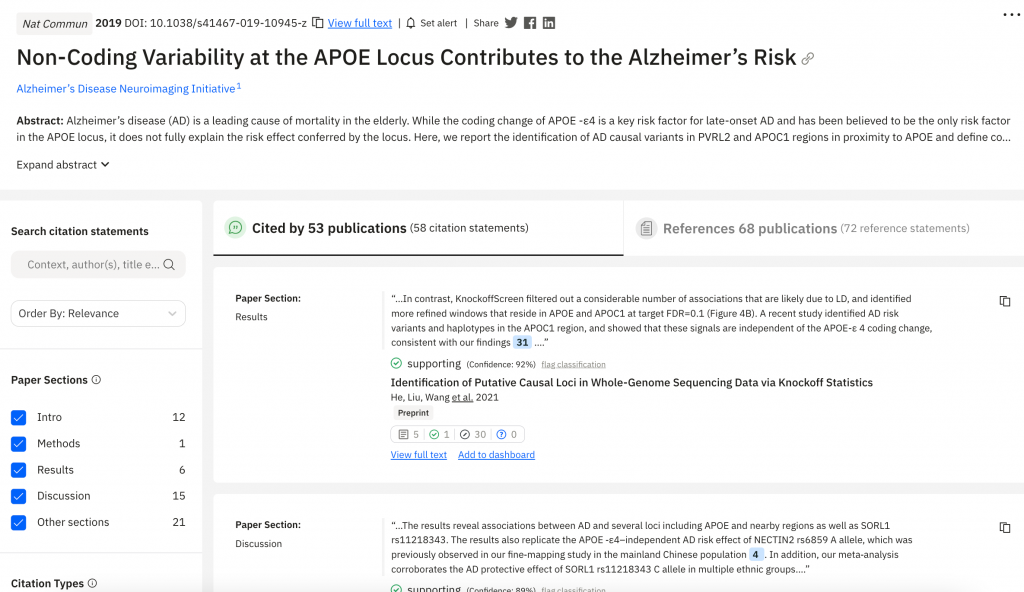
Further down the webpage, we can see a sortable table of all the articles included in this dashboard (Figure 2), along with the respective citation tallies they have received from other publications. The table allows you to see which articles in that group are most contrasted, supported, and so on. Clicking on the title of the article takes you to its corresponding Scite citation report of the paper (Figure 3).

Figure 2. Sortable table of publication records

Figure 3. Scite citation report of a paper
Keeping Informed
You can also configure a notification by setting up an alert to receive email notifications for new citations to any paper in this group. Creating dashboard and viewing aggregate metrics is simple and straight-forward. This would be a good feature for keeping up-to-date on your publication list, or groups of papers of your interest.
How to Make a Dashboard
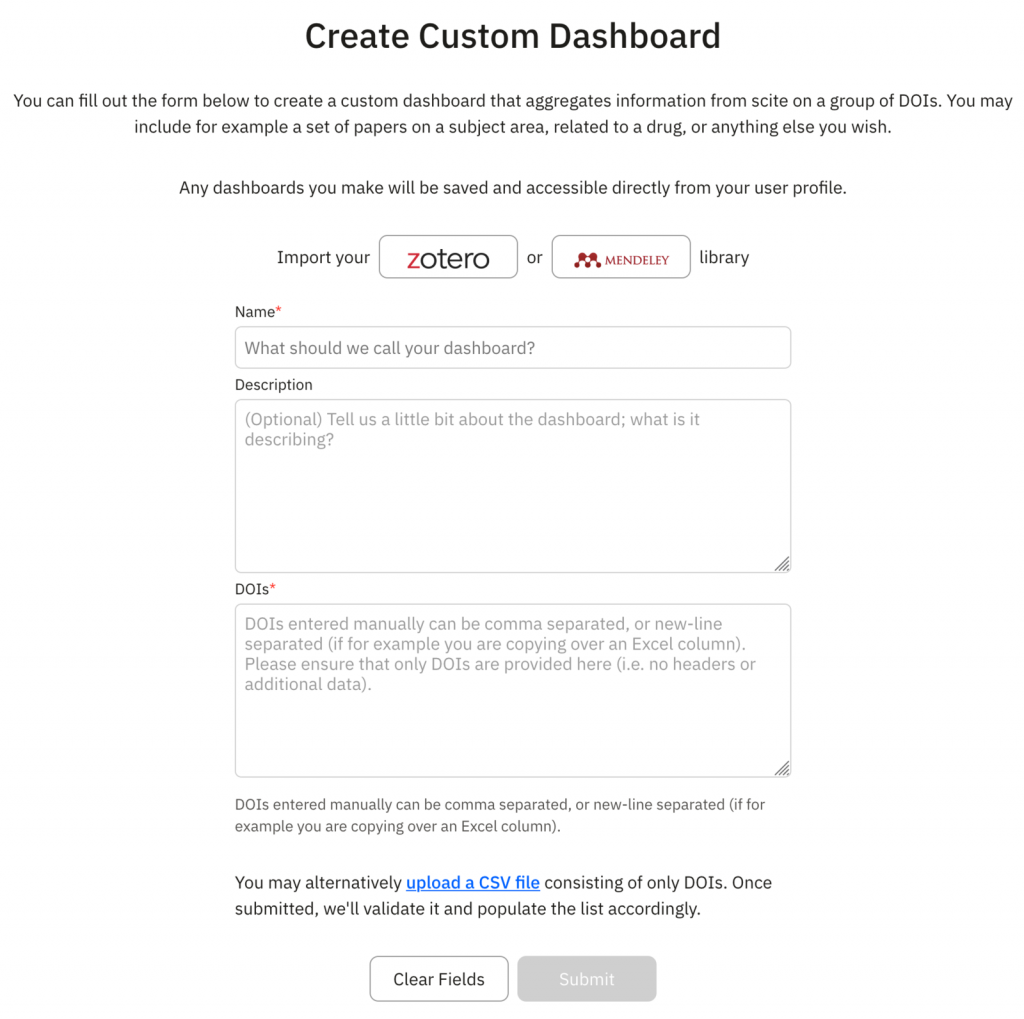
Custom dashboards can be made by navigating to the Tools tab and clicking on Dashboard. There are currently four ways you can make a custom dashboard (Figure 4):
- Import from Zotero library
- Import from Mendeley library
- Manually enter a comma separated list of valid DOIs (max. 1,000 DOIs each)
- Upload a CSV file containing a comma separated list of valid DOIs (max. 1,000 DOIs each)

Figure 4. Create custom dashboard in scite.
New Resource in Our Collection: Scite.ai
The subscription to scite.ai (Premium Plus Plan) was recently confirmed following a trial access of this platform in December last year. To enjoy the premium plus features such as the dashboard feature demonstrated in this post, you need to sign in or create a personal account. After signing in, you can further enhance your profile and publication list by syncing your articles from ORCID, or claim papers manually to collect citation metrics from your articles and to your articles.
– By Jennifer Gu, Library
Views: 424
Go Back to page Top
- Category:
- Research Tools
Tags: scite
published March 24, 2022


