


Discover Research Literature Using Visuals: Litmaps
This week we will show you a tool to find research papers through literature connection networks. It can also help you get insights into literature in your topics.
You often search for literature using keyword matching or citation references. In either way, traditional databases usually return linear lists of papers for you to read and select. Now, there are visualizing tools that present research papers in 2-D graphs; you can easily see the connections between the papers, either because they are similar or have citation relations. It can help you build better insights into the literature of your topics; you may even discover papers that you would not have found otherwise. In previous posts, we shared such tools including ResearchRabbit, Connected Paper, Inciteful and VOSviewer. This time we will introduce Litmaps, by trying out different ways to explore a topic.
About Litmaps
Litmaps is a web application that lets you search in a database of many publications. It can visualize the papers as network graphs based on publication years, citations, citing relations, and title similarity. Based on the connections between papers, Litmaps can make suggestions to help you find papers without you coming up with a keyword for searching. This interesting feature becomes very useful when you want to explore a topic beyond your known literature.
You can sign in Litmaps using your ORCID.
Keyword search in Litmaps
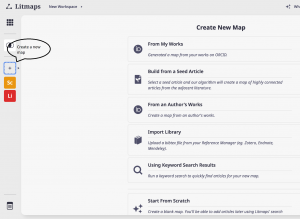
Figure 1
After you sign in, you can create new maps by different means (Figure 1). In this example, we will do a keyword search.
Let’s imagine you want to find papers of your research, which is about aging population in Asian countries and their social policies. You may put in “aging population social policy asia” in the search box, then use the 20 suggested articles to create a map (Figure 2).
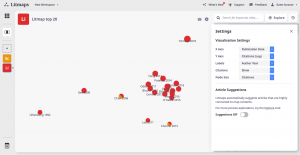
Figure 2
With the settings shown on the right panel in Figure 2, the graph can quickly give you an overview of the 20 articles:
- Time distribution: they range from 1992 to 2018, most of them are published between 2011-2016
- Citation impact: one paper stood out as highly cited (Titmuss 2018)
- Citation links: there is only one citing relations among these 20 papers according to Litmaps’ data – Chomik 2015 cited Lee 2011
This does not look very interesting yet, but there is a lot of potential to build the literature further:
- When you mouse over the nodes, you can see details of each paper. Some may not be relevant to your interest; you can easily remove them from the map.
- Litmaps suggests related papers (see more below) so that you can add to the map
- As these papers do not seem to cite each other much, that implies that there are many more clusters of paper you can pull out!
Import results from another database to build maps
You may find that not all Litmaps’ initial search results are relevant. Let’s say you conduct the same search In the database Scopus, which gave you over 300 articles with the same keywords (search conducted in Feb 2022). For comparison, we downloaded the bibliographic data of the 20 most relevant records from Scopus as bibTex file, then import into Litmaps for visualization (Figure 3). It shows that this set
- Goes from 1987 to 2016, and the papers are more spread out in time as compared to the Litmaps results.
- The highest citing paper is Chan 2016; it cited Hermalin 1997; you can also see another pair of citing relation in the map
- As indicated by the colors of the nodes, two papers appear also in the Litmaps results: Chan 2006 and Chomik 2015
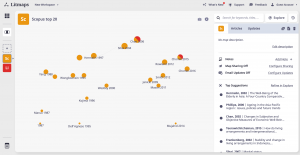
Figure 3
Add papers by “suggestions” and using “seed paper”
One strength of these visualization search tools is the ability to locate more papers through connections. Litmaps shows the suggestions on the right panel for you to add more papers to the map. For example, based on the previous two maps, we can merge them, remove some articles that look less relevant, and add suggestions that we find useful, resulting in a more complex map with more nodes and citation links (Figure 4).
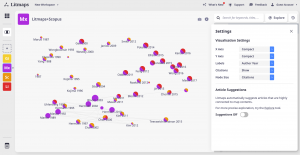
Figure 4
Another way to explore literature using the connections between papers is to build a map using one seed paper. For example, you may find the following article on one-child policy very useful for your research on aging population; and you are interested to capture articles that connect to it:
Using the doi of the paper, you can create the seed map (Figure 5). It shows not only the citing and cited papers of the seed article, but also other papers that are considered similar. For example, Gu 2016 is not cited by our seed paper, but judging by the title (Figure 6), it should also be relevant to the topic.
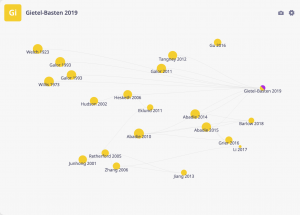
Figure 5
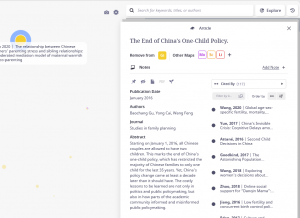
Figure 6
Create insights
You can use Litmaps in other ways apart from literature searching. Visualizing a set of papers can give you an overview such as time distribution, landmark papers in the field, and key authors. Here are some possible use cases:
- If you find a good literature review paper, you can map the references of the paper to see how the topic develops.
- Visualize the references in your thesis; you may find gaps that you want to fill in.
- Make a chart of the work of a key author or an important research group.
Litmaps is interesting and helpful in exploring literature. However, like many emerging tools that use open data and develop their own algorithms, their data may not be as comprehensive as proprietary databases; and their interface and availability may change quickly.
